Contents
Introduction
This Module details the monitoring requirements for storage of CO2 removed from the atmosphere via engineered carbon removal technology (such as Direct Air Capture) and stored as Dissolved Inorganic Carbon using closed engineered systems.
CO2 storage in closed engineered systems refers to reacting concentrated CO2 with crushed rock or mineral feedstock in a controlled reactor, enabling long-term removal and durable storage. The use of closed engineered systems accelerates the natural chemical reaction of mineral weathering, which constitutes a durable (>1000 years) sink for CO2. This is possible because operating within a closed engineered reactor allows several parameters that drive the reaction rate (i.e. temperature, pressure, pCO2) to be precisely controlled. Additionally, because a reactor is a closed system, carbon conversion can be accurately and precisely determined with targeted measurements of the ingoing and outgoing CO2 stream and feedstock. When implemented correctly, this provides high confidence in the amount of stored CO2.
Weathering of rock is a critical feedback mechanism for global climate regulation on geologic timescales and naturally sequesters 0.1-0.3 Gt of CO2 per year1. In this process, CO2 dissolves in surface water (generating carbonic acid (H2CO3), and reacts with silicate or carbonate rocks, forming bicarbonate (HCO3−) and carbonate (CO32−) ions (referred to collectively hereafter as Dissolved Inorganic Carbon, DIC). The DIC is transported through river systems to the ocean where it can be stored either in the ocean or be mineralized into carbonate minerals, both of which constitute stable sinks of CO2 on millennial timescales.
Natural weathering processes can be accelerated by grinding rock to expose additional surface area; this is called Enhanced Weathering (EW) and has been proposed as a promising carbon removal strategy. EW can be deployed in a diversity of open-system environments, including agricultural land 2,3,4,5 (e.g. Isometric Enhanced Weathering in Agriculture Protocol) and coastal systems6,7. EW can also occur in closed engineered reactors to simplify monitoring requirements 8,9,10,11. This is known as enhanced weathering in closed engineered systems. In enhanced weathering in engineered systems, concentrated CO2 dissolved in water reacts with alkaline feedstock (often pre-treated to increase reactivity) and is stored as DIC2,8,10,12. The resulting carbon-rich effluent is then transported either directly to the ocean, or to a river basin which drains to the ocean, for storage on millennial timescales 13,14. Elevated temperature and pressure may not be required in enhanced weathering in engineered systems because, in some cases, dissolution of alkaline rock is not kinetically inhibited at ambient temperature and pressure conditions 15,16,17 assuming that the closed system is maintained in a state of disequilibrium. When carbonic acid is the only acid source, both mafic/ultramafic and carbonate feedstocks can be used in engineered enhanced weathering applications.
This Module outlines the requirements for evaluating carbon storage in the aqueous phase via reaction of feedstocks, with an emphasis on in-line measurements of influent/effluent CO2. Requirements for reactor design, calculation of carbon stored and CO2 monitoring are given in Sections 2, 4 and 5 of this Module respectively. Requirements for feedstock characterization can be found in the Rock and Mineral Feedstock Characterization Module.
Project Types and Applicability
This Module is applicable to any Project in which a rock or mineral feedstock is weathered in an engineered system, with final aqueous storage of DIC in the ocean. Applicable Projects must meet the following requirements:
- CO2 (from eligible sources listed below) is introduced to a reactor before or after the placement of alkaline feedstocks;
- The CO2 is not derived from a fossil fuel source. Eligible CO2 sources include Direct Air Capture (DAC), Biogenic CO2 Capture (BCC), Direct Ocean Capture (DOC);
- The removed CO2 is stored in the aqueous phase as DIC, subject to conversion efficiencies and speciation that must be quantified and reported by the Project;
- All applicable permits and regulatory requirements for fluid discharge are met;
- The CO2 stored as DIC is finally stored in the ocean. Thus, eligible Projects must discharge directly into the ocean from coastal outfalls, or to rivers and estuaries where the discharge will be transported to the ocean. Most rivers will reach their basin outlet within one to two months 18. Long term storage in inland waters (e.g. lakes) will be explored for future iterations;
- Other storage locations may be considered on a case-by-case basis, in consultation with Isometric.
System Requirements
To be eligible for Credits using this Module, CO2 must be reacted with alkaline feedstock in an engineered reactor. This section details the requirements for reactor design and maintenance. These requirements are applicable to any and all reactors used in the Project.
Reactor Type
Any type of engineered chemical reactor is eligible under the Module, provided that the reactor design requirements set out in Sections 2.2 to 2.5 are satisfied. Acceptable reactor types include, but are not limited to, stirred tanks (batch, semi-batch or continuous) and tubular reactors (plug flow, fixed bed, fluidized bed, bubble bed or trickle bed). This list is meant to be comprehensive, but not exhaustive. A brief overview of common reactor types covered under this Module is provided in Table 1. Novel reactor designs not belonging to any of the categories listed here will be acceptable provided that the appropriate reactor design documentation is supplied in the PDD. All reactor designs, including the reactor type, engineering design diagrams, reactor modeling calculations and materials selection must be included in the PDD. Note that sensitive information pertaining to intellectual property may be redacted from the public-facing PDD in consultation with Isometric.
Design Diagram Requirements
An engineering design diagram of the chemical reactor must be included in the PDD. The design diagram must include details of the dimensions of the reactor, the locations of material inflows/outflows, the positioning of sensors for the monitoring of flow rate, reactant/product chemical composition, temperature and pressure, details of any internal equipment such as agitators or heating/cooling coils and details of any external heat transfer equipment (including heat exchange fluid entry/exit points and corresponding sensors for flow rate and temperature). The discharge system design must follow applicable regulatory requirements and industry best practices for effluent management, including appropriate diffusion, mixing, and monitoring infrastructure as required by discharge permits. A sufficient number of viewpoints must be included in the engineering design diagram to show the positioning of all of the key components listed above. Any other process equipment essential to the safe and effective operation of the reactor not listed above should be included and highlighted in the engineering design diagram.
CO2 and Feedstock Loss
The reactor design must include sensors necessary to quantify any loss of CO2 during operation of the reactor. This should include, at minimum, sensors to determine the inflow/outflow of CO2 from the reactor, which can be used in conjunction with a suitable reactor model (Table 1) to determine the amount of CO2 reacted and to estimate any loss of CO2. Only CO2 which has been determined by this calculation to be in the form of DIC through reaction with rock or mineral feedstock is eligible for Credits under this Module.
In addition to possible loss of CO2 from the reactor, Project Proponents should consider the possibility of rock or mineral feedstock loss from the reactor in applicable systems. For example, in a fluidized bed reactor, it is necessary to set flow rates such that the loss of solid feedstock particles from the system is minimized. Projects using reactors in which this is a risk are required to characterize feedstock loss; further detail is given in Section 5.1.3.
Direct measurement of reactor performance such as CO2 conversion, HCO3− production, and mineral feedstock loss, can be one approach for quantifying chemical reactor performance and outputs. Project Proponents must include a detailed sampling plan describing measurement locations, frequency, and analytical methods, as well as procedures for quality assurance and control. Where direct measurements are not feasible, Project Proponents may use a chemical reactor model. The chemical reactor model used to characterize reactor performance and estimate CO2 and solid feedstock losses should consider all physical and chemical mechanisms relevant to operation of the chosen reactor type. The chemical reactor model must incorporate a chemical kinetics model which is based on the latest scientific understanding for the chosen chemical reaction pathway. Where chemical kinetics are derived from in-house experimental measurements, details of the experimental procedure used to perform these measurements should be included in the PDD.
Construction Considerations
Suitable mass/volume flow meters must be placed on all material inlets and outlets from the reactor to allow for characterization of reactor performance and to monitor any material losses to the environment. These sensors must be positioned immediately upstream and downstream of the reactor. Suitable sensors to measure pressure, temperature and pH should be implemented to allow for accurate characterisation of the reactor performance through a combination of measurements and modeling. For stirred tank reactor types, these sensors should be placed so that they accurately characterize the measured property in the bulk phase of the reactor. For tubular reactors, two (or more) measurements of each property at different locations may be necessary to accurately characterize the reactor performance. In this case, several sensors must be placed along the length of the reactor. Justification for the positioning of such sensors for characterization of reactor performance should be provided in the PDD.
It is anticipated that operation of the chemical reactor may occur at high temperature and pressure, and that the pH inside the reactor may be acidic. Appropriate considerations need to be made in the design of the reactor to mitigate adverse operational conditions to ensure operational loss prevention. Details must be provided in the PDD to describe the selection of materials for each component of the reactor, including justification for these choices addressing heat and corrosion resistance. For reactors operating at high pressures, considerations should be made relating to the operating pressure, vessel shape/size, positioning of material inlets/outlets, and positioning of sensors to ensure mechanical integrity of the reaction vessel. Such considerations should be made in compliance with a suitable local standard which provides regulations for the design and fabrication of pressure vessels, such as 2014/68/EU (the “Pressure Equipment Directive”) or an appropriate regional equivalent standard in the region of operation.
Reactor Maintenance
An appropriate reactor maintenance plan must be in place, and must be detailed in the PDD. The maintenance plan should outline how the Project Proponent will ensure the structural integrity of the reactor vessel to mitigate against potential material loss events. This includes suitable monitoring and mitigation for mechanical, thermal and corrosive events which may lead to failure of the vessel and subsequent release of reaction materials into the environment. All maintenance plans are required to be in compliance with a suitable local standard which provides regulations for the maintenance of pressure vessels, such as 2014/68/EU or an appropriate regional equivalent standard in the region of operation.
Table 1. Reactor type overview
| Reactor Category | Reactor Type | Description |
|---|---|---|
| Stirred tank | Batch | A closed well-mixed batch system where reactants are added to the vessel at the start of the batch, and products are removed from the vessel at the end of the batch. Mixing is conducted by stirring with an agitator. |
| Semi-batch | A well-mixed batch system where reactants are added to the vessel at the beginning of the batch, and products are removed at the end of the batch. Reactants and/or products may be added/removed from the vessel over time throughout the batch. Mixing is conducted by stirring with an agitator. | |
| Continuous | An open well-mixed system where reactants and products are both added/removed from the vessel continuously. Mixing is conducted by stirring with an agitator. | |
| Tubular | Plug flow | A simple open tubular reactor where reactants flow through the vessel and chemical reaction occurs along the length of the vessel. |
| Fixed bed | An open tubular multiphase reactor where reactants flow over a fixed packed bed of solid reactive material. Chemical reaction occurs along the length of the vessel. | |
| Fluidized bed | An open tubular multiphase reactor where reactants fluidize a bed of solid reactive material. Fluid reactants and solid material flow co-currently within the vessel. Chemical reaction occurs along the length of the vessel. | |
| Bubble bed | An open tubular multiphase reactor where gaseous reactants flow in a vessel saturated with liquid. The gaseous species migrate through the column as bubbles of gas. Chemical reaction occurs along the length of the vessel. | |
| Trickle bed | An open tubular multiphase reactor where liquid reactants flow downwards over a packed bed of reactive solids, while gaseous species flow upwards. Chemical reaction occurs along the length of the vessel. |
Feedstock Characterization and Pre-treatment
All feedstocks must be characterized according to the Rock and Mineral Feedstock Characterization Module prior to commencement of Project activities. Some feedstocks may be exempt from certain characterization requirements, which will be determined on a project-by-project basis.
Some Project Proponents may choose to pre-treat their feedstock to increase reactivity. Methods of pre-treatment may include, but are not limited to:
- Additional crushing or grinding after obtaining feedstock material but prior to the onset of project activities
- Thermal activation, particularly if using serpentinite minerals19
- Chemical activation using reagents, which may include (but is not limited to):
Any pre-treatment must be fully described in the PDD, including:
- Rationale for pre-treatment
- Method used
- Physical and chemical characteristics of the feedstock after pre-treatment, if employing physical, thermal or chemical activation methods
Project Proponents using thermal activation or chemical activation with acid for feedstock pre-treatment must demonstrate that there were no carbonate minerals in the feedstock prior to treatment. If carbonate minerals are present in the feedstock prior to pre-treating, Project Proponents are required to characterize the mass of carbon potentially lost during heating and include this in calculations of GHG emissions related to project activities. Additionally, all emissions associated with pre-treatment processes, including energy consumption during thermal activation, chemical production and use during acid treatment, and any other process-related emissions, must be considered and calculated as part of the Project's overall GHG accounting.
Use of Aqueous Alkaline Feedstocks
In some instances, alkaline feedstocks (such as NaOH) that are dissolved in a fluid stream may be applicable under this Module. Project Proponents using these feedstocks are required to characterize the following parameters:
-
Carbonic acid system (more details of the carbonic acid system can be found in the Carbon Acid System section), including:
-
pH (via direct measurement -- e.g., ISO 10523:2008)
-
Alkalinity (via titration -- e.g., ISO 9963-1:1994)
-
Dissolved Inorganic Carbon (DIC; via acid titration or infrared detection)
-
pCO2 (via e.g., headspace equilibration and gas chromatography, infrared spectroscopy)
-
-
A full suite of elemental composition (see the Elemental Characterization section of the Rock and Mineral Feedstock Characterization Module) by either inductively coupled plasma mass spectrometry (ICP-MS; e.g., ISO 17294-1:2024) or inductively coupled plasma optical emission spectroscopy (ICP-OES; e.g., ISO 11885:2007) as the primary determination method. Project Proponents should take analytical precision and detection limits into account when determining their measurement method.
Calculation of CO2 Storage via Enhanced Weathering in Engineered Systems
This section details the calculation of net CO2 storage for engineered enhanced weathering projects. The monitoring requirements are described in detail in Section 5. Engineered enhanced weathering projects are subject to some additional monitoring requirements for downstream losses associated with transport and storage of captured carbon in the aqueous form (See Enhanced Weathering in Agriculture Protocol).
Calculation of CO2eRemoval,RP
The quantity of net CO2 removed for each Reporting Period, RP, can be calculated as follows:
(Equation 1)
Where:
- is the net quantity of CO2 removed as a result of project activities during a Reporting Period, in tonnes of CO2e.
- is the total quantity of inorganic carbon stored in the aqueous form during a Reporting Period, in tonnes of CO2e.
- is the total CO2 removed from the atmosphere and permanently stored in the baseline scenario for a given Reporting Period, in tonnes of CO2e. This is the amount of inorganic carbon that would be stored in a given feedstock across the lifetime of a Credit as a result of natural weathering.
- is the total quantity of GHG emissions from project activities for a Reporting Period, in tonnes of CO2e.
Calculation of CO2eStored,RP
can be calculated as:
= -
(Equation 2)
Where:
- is the difference in Dissolved Inorganic Carbon (DIC) concentration between the point of fluid introduction (influent) and at the point of fluid exit from the system (effluent), summed across a Reporting Period, in tonnes of CO2e.
- is the sum of CO2 reversals across a Reporting Period, in tonnes of CO2e. See Section 4.1.3 for more details on calculating this term.
Calculation of CO2eWeathered, Eff-Inf, RP
is calculated as:
(Equation 3)
Where:
- is the effluent CO2e based on measurements of weathering products summed over the Reporting Period, in tonnes of CO2e.
- is the influent CO2e based on measurements of weathering products summed over the Reporting Period, in tonnes CO2e. This represents the baseline water conditions prior to enhanced weathering in the reactor system.
The in influent and effluent streams can be calculated as:
(Equation 4)
Where:
- is the total CO2e removed by feedstock weathering in stream over the Reporting Period, in tonnes of CO2e.
- is the time period over which measurements are averaged, in minutes.
- is the total number of time intervals summed over in Reporting Period .
- is the difference in concentration of weathering product in stream over time interval , in moles per kilogram of fluid. Weathering product can be either the concentration of an element relevant to the feedstock used (e.g. Ca if using calcium carbonate) or the concentration of DIC.
- is the average density of fluid in stream over time interval , in kilograms per liter.
- is the average flow rate of stream over time interval , in liters per minute.
- is the molar ratio of CO2 removed per mole of weathering product .
- is the molecular mass of CO2, tonnes CO2e per mole.
must be calculated from direct fluid measurements of the influent and effluent, collected at intervals justified by the reactor design, CO2 introduction point, and flow rate. may be calculated from either cation measurements (as justified by the specific mineralogy of the utilized feedstock) or three components of the carbonic acid system (see Section 5.1.2). Project Proponents are required to submit mass balance calculations consisting of both cation and carbonic acid system measurements to demonstrate that their calculations are not impacted by degassing. These calculations must fall within either 3 standard deviations from the mean or a 5% error margin; the more conservative estimate of the two will be used. If the measurements do not fall within these margins, an audit will be undertaken by the Isometric science team to determine the result of the discrepancy.
Project Proponents must justify the chosen frequency of direct fluid measurements on the influent and effluent in the PDD with regards to achieving an accurate characterization of anticipated changes in DIC in both streams over time. Project Proponents must clearly outline their approach to calculation in the PDD.
Calculation of CO2eLosses,RP
CO2eLosses,RP where CO2eWeathered,RP is calculated from cation measurements
Where cation measurements are used to quantify Project Proponents must consider the amount of feedstock that is weathered as a result of non-carbonic acid dissolution. Thus, is calculated as:
(Equation 5)
Where:
- is the amount of weathering that occurs due to non-carbonic acid, over a Reporting Period.
- is the amount of captured CO2 lost in rivers and upon entering the ocean during transport to the final storage reservoir in the ocean over a Reporting Period. Details on calculating these loss terms are described in Section 4.1.3.3.
- is the amount of captured CO2 lost as a result of other processes than those listed above, such as the formation of secondary minerals, over a Reporting Period.
Non-carbonic acid weathering can be calculated by the difference between anion concentrations in influent and effluent streams:
(Equation 6)
(Equation 7)
Where:
- is the total CO2e released as a result of non-carbonic acid weathering in stream over time interval , in tonnes CO2e.
- is the time period over which measurements are averaged, in minutes;
- is the total number of time intervals summed over in Reporting Period ;
- (Equation 8)
- is the concentration of anion, , in moles per kilogram in stream, , over time interval ;
- is the charge of the anion, .
- is the average density of fluid in stream over time interval , in kilograms per liter.
- is the average flow rate of stream, , over time interval , in liters per minute.
- is the molar ratio of CO2 lost per mole of non-carbonic acid.
- is the molecular mass of CO2, tonnes CO2e per mol.
Calculation of CO2eLosses,RP where CO2eWeathered,RP is calculated from carbonic acid system measurements
Projects quantifying through measurements of the carbonic acid system implicitly include feedstock dissolution from non-carbonic acid. Thus, is calculated as:
(Equation 9)
Where:
- is the amount of captured CO2 lost in rivers and upon entering the ocean during transport to the final storage reservoir in the ocean. Details on calculating these loss terms are described in the section below. This is calculated for a full Reporting Period, rather than spread across discrete measurement periods.
- is the amount of captured CO2 lost as a result of other processes than those listed above, such as the formation of secondary minerals.
Calculation of Downstream Losses
The effluent exiting the reactor is enriched in TA and DIC compared to the receiving waters. After discharge into the receiving waters, losses may reduce the efficiency of CO2 stored as a result of project activities.
Processes that can lead to losses include:
- Re-equilibration of the DIC system
- Carbonate precipitation
- Reduction in natural alkalinity fluxes
- Changes in biotic calcification (for ocean discharge only)
Losses may occur in a number of locations, depending on the Project. In general, losses must be considered in the near field of the discharge site, as that is where the risk of losses are highest. For river discharges, losses may also occur along the transport pathway from the effluent discharge to the final storage reservoir, the ocean. As such, losses along river transport and upon entering the ocean must also be considered. Any losses that cannot be justified as negligible must be quantified and deducted from gross carbon removal.
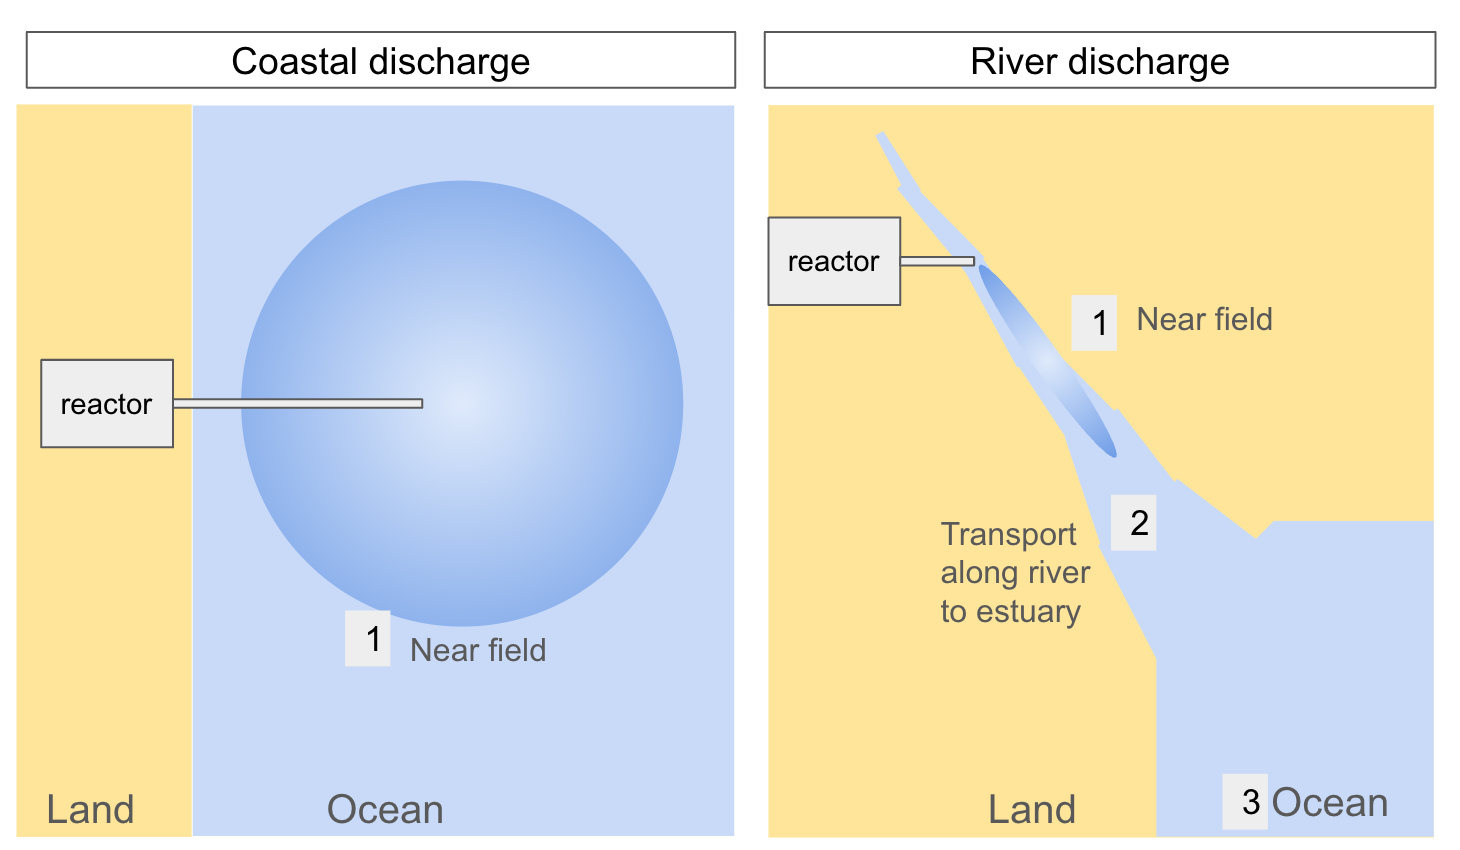
Figure 1 Example schematic of where downstream losses may occur, and the spatial zones which must be considered for coastal and river discharges.
The downstream losses is calculated as:
(Equation 10)
Where
- is as defined in Equation 3
- is as defined in Equation 5, or else is 0 if Equation 9 is used.
- is as defined in Equations 5 and 9
- represents the overall loss discount for a Project.
The overall loss discount for a Project is the product of the loss factors associated with each loss process:
(Equation 11)
Where:
- is the overall loss discount for Reporting Period;
- is the fraction of CO2 that is retained after a given loss,
- is the total number of loss processes.
The loss processes which must be considered for ocean and river discharge are indicated in Table 2.
Table 2. Losses and their corresponding spatial zones. All losses in column 1 ""Mixing zone of discharge site" are to be considered for both coastal and riverine discharge, unless otherwise indicated. Transport losses in columns 2 and 3 apply only to riverine discharge. The risk of these losses must be described in the PDD, and justified if they are negligible or need to be quantified.
| Loss Process | 1) Mixing Zone | 2) River/Estuary transport (Riverine discharge only) | 3) Ocean (Riverine discharge only) |
|---|---|---|---|
| Re-equilibration of DIC | x | x | x |
| Carbonate precipitation | x | x | |
| Natural alkalinity reduction | x | ||
| Biotic calcification | x (Coastal discharge only) |
In the PDD, Project Proponents must describe the risk of these losses, as well as either (1) a justification of why the losses are negligible or (2) a strategy for quantifying a corresponding loss factor. Due to the difficulty and uncertainty in quantifying the impact of these processes at this time, acceptable treatment of losses in this Protocol include:
- Avoiding the likelihood of these losses by identifying avoidance strategies around conditions which lead to non-negligible loss terms, with corresponding monitoring to demonstrate adherence to those guardrails
- Estimating a conservative upper limit of loss based on scientific literature, first principles calculations, and/or experimentation
- Process-based modeling studies
- Direct measurements
- Alternative approaches that are sufficiently justified
Data, measurements and evidence used in the quantification of loss factors must be publicly disclosed. Example recommendations for each loss process are discussed below. Much of the existing research in these losses have been motivated by research in Enhanced Weathering, River Liming, and Ocean Alkalinity Enhancement, which may not exactly simulate the carbonate chemistry state of the effluent from the processes described in this Module. Project Proponents are recommended to conduct additional site-specific studies to optimize loss estimates and research on the relevant carbonate chemistry parameters for their particular process conditions.
Near-Field Losses
The near-field zone comprises the spatial extent of initial mixing upon discharge, sometimes known as the mixing zone. Generally, the risk of losses are modulated by saturation states and environmental conditions. The risk of these losses declines further from the discharge site, since the perturbation from the effluent will become increasingly dilute.
Re-equilibration of DIC
Concept
Equilibrium speciation of DIC is primarily dependent on pH, and to a lesser extent temperature, salinity and pressure:
(Equation 12)
The extent and rate of re-equilibration are highly site and project specific, depending on local water chemistry, hydrodynamic conditions, and effluent characteristics. The release of CO2 due to re-equilibration of DIC may occur due to mixing of fluids. This may occur upon initial mixing of effluent with the receiving water body, or at river confluences and when rivers discharge to the ocean.
Quantification
For riverine discharge, the recommended quantification approach for outgassing upon initial mixing is to use the two endmember mixing model to estimate the DIC of the effluent and ambient water mixture. The difference between the measured DIC of the effluent and DIC of the mixture is the outgassing loss.
For coastal discharge, Project Proponents may use the two endmember mixing model option above or one of the options in Section 4.1.3.4.2.
Carbonate Precipitation
Concept
Secondary precipitation of calcium carbonate could cause CO2 outgassing by the following reaction:
(Equation 13)
Calcium carbonate precipitation may result in a reduction in carbon loss up to 50% for non-carbonate feedstocks or up to 100% for carbonate feedstocks.
Discussion
In rivers and coastal areas, higher suspended particulates may increase nucleation. Early research suggests there is a relationship between increased alkalinity loss with higher TSS (Total Suspended Solids) in the receiving water body23. Thus, the risk of secondary precipitation is most pronounced in the mixing zone of the outfall, where the carbonate chemistry and TSS perturbation are largest.
Limiting pH and the saturation state has been shown to be effective at avoiding this result, and laboratory research to characterize the critical thresholds that trigger precipitation under close-to-natural conditions are ongoing 24,25,26,27. Furthermore, precipitation dynamics occur on a timescale between minutes to hours 24,26, which suggests that dilution could be an effective risk mitigation strategy28.
Quantification
An example avoidance strategy is setting a threshold on TA and saturation state, with consideration of environmental conditions including carbonate chemistry variables, TSS and dilution at the site 29. Continuous monitoring of carbonate chemistry variables and TSS is recommended to ensure that conditions for secondary precipitation are avoided. In some cases, secondary precipitation can be identified by an observed increase in turbidity. Monitoring of turbidity is recommended, however it may be difficult to isolate a signal from secondary precipitation over natural fluctuations.
Natural Alkalinity Flux Reduction
Concept
Increased alkalinity in reactor effluent can potentially reduce the natural alkalinity flux from marine or river sediments30. This risk may be exacerbated by projects with settling particles that result in local alkalinity enrichment in marine or river sediments, and the potential impacts on the net removal calculation is uncertain at this time. More research in this area is needed and the Module will be updated with future advancements.
Quantification
A recommended avoidance strategy is to limit accumulation of alkalinity on the river or sea bed through careful design of discharge rates. If this risk cannot be avoided, potential approaches should be adopted by Project Proponent include:
- Conduct early consultation with relevant regulatory authorities to establish acceptable monitoring and assessment approaches.
- Implement quantitative assessment through one or more of the following methods:
- Numerical modeling of particle transport and alkalinity distribution in receiving waters
- Regular sediment sampling and chemical analysis at discharge points and reference sites
- Direct measurement of benthic alkalinity fluxes using chamber or eddy correlation techniques
- Develop monitoring plans that demonstrate compliance with applicable water quality standards and environmental regulations.
Changes in Biotic Calcification
Concept
For coastal discharges, increases in marine biotic calcification can cause CO2 outgassing. The carbonate chemistry conditions promoted by coastal discharge of alkalinity-enhanced wastewater could promote calcification due to the lowered H+ or elevated saturation state31,32,33,34. Alkaline feedstock dissolution may release trace metals which has the potential to fertilize blooms of calcifiers34.
Discussion
Early stage research manipulating total alkalinity with the aim of simulating OAE has found no significant increase in biologically produced calcium carbonate at elevated alkalinity in the ocean 35,36. However, the Black Sea, a naturally elevated alkaline environment, harbors extensive blooms of the coccolithophores37,38, a major group of calcifying plankton. This is thought to be due to the favorable carbonate chemistry promoted by the elevated alkalinity regime34.
This is still an area where more research is needed, particularly through mesocosm and field trials, albeit there is a rich body of literature on lab and mesocosm scale species-specific responses to changing seawater carbonate chemistry39,40,41. The risk of outgassing due to biotic calcification may be project and location specific. Recently published meta-analyses synthesizing data from ocean acidification studies for OAE supports this claim that species and functional group specificity is likely42. Coastal areas with significant benthic calcification of CaCO3 sediments may be especially susceptible to this feedback.
Quantification
A recommended avoidance strategy is setting thresholds on pH and TA based on what has been shown in previous studies to have no significant increase in biologically produced CaCO343, or as determined for the specific deployment site, and monitoring for changes in ocean biota.
Transport Losses
For riverine discharge, the effluent alkalinity is transported through rivers and eventually, to the oceans. The transport of carbonate and bicarbonate ions along the river may result in carbon losses through the re-equilibration of DIC or calcium carbonate precipitation. Risks of these losses are more pronounced at major confluences along the river network. Project Proponents must quantify a loss discount for both re-equilibration and precipitation along rivers and upon entering the ocean.
Where quantification is carried out through modeling approaches, Project Proponents must provide detailed information on the model selection, input datasets, validation approaches, and relevant transport modeling timescales. For projects operating in the UK and EU, Project Proponents must utilize existing long-term freshwater and groundwater health status datasets and models developed under the Water Framework Directive (2000/60/EC) and the Groundwater Directive (2006/118/EC) where applicable, and demonstrate how these regulatory frameworks inform their transport loss assessments.
Outgassing During River Transport
Quantification
To account for potential losses along river transport, Project Proponents must estimate potential losses along the river network through measurement or models. Recent publications have outlined modeling approaches that combine baseline river geochemical data, equilibrium modeling of water chemistry and scenarios of terrestrially exported DIC, which may serve as useful references44,45.
The minimum requirements for river transport loss models are:
- Domain:
- Full river network through which bicarbonate and carbonate ions will be transported
- Inputs:
- River characteristics:
- Baseline calcite saturation index (SIc)
- pH
- pCO2
- Alkalinity
- Effluent characteristics:
- Discharge rate
- Alkalinity fluxes
- Cation fluxes
- River characteristics:
- Outputs:
- SIc along river
- pH along river
- Efficiency or discount factor on river transport loss for re-equilibration of DIC
- Efficiency or discount factor on river transport loss for carbonate precipitation
Project Proponents are required to submit a detailed description of their modeling approach, including the model used, the river/watershed data used in model construction and the source of that data. Alternate approaches may be considered on a case by case basis.
*Note on calcite saturation index in rivers
Calcite saturation index (SIc) is a useful parameter to determine the likelihood of carbonate precipitation. SIc is calculated as:
(Equation 14)
With:
(Equation 15)
Where:
- is the measured solution activities of those ions
- is the ion activity at saturation
When SIc > 0, a river is considered supersaturated. Although supersaturation with respect to calcium carbonate does not necessarily result in calcium carbonate precipitation, typically, calcium carbonate precipitation is predicted at a SIc > 145. Kinetics and the presence of other elements can inhibit precipitation even at higher saturation states. Laboratory experiments simulating local water conditions can be used to bolster predictions of precipitation risk during river transport.
Outgassing Upon Entering Ocean
Discussion
Once alkalinity reaches the ocean, changes in pH, temperature or salinity can shift the carbonate system and result in a re-equilibration of DIC. Estimates from peer-reviewed studies suggest that marine losses of terrestrially exported DIC could amount to 10-30% loss of carbon, depending on temperature, salinity, pCO2, and ocean circulation 46,47,48. Typically, the ocean has a higher pH than rivers, which shifts the carbonate equilibrium towards a higher proportion of CO32− in oceans. As a result, the amount of DIC stored per unit of alkalinity decreases between inland waters and the ocean. In addition, changes in salinity and saturation state upon reaching the ocean, as well as mixing-induced calcite undersaturation that occurs when waters in carbonate equilibrium are combined, can lead to calcium carbonate precipitation or dissolution49.
Quantification
Outgassing upon entering the ocean must be quantified using regional data specific to the area where the river reaches the ocean. This loss can be estimated with one of the following approaches:
- Using the Renforth and Henderson (2017) uptake efficiency equation14
- Using a 3D Earth Systems Model or ocean physical-biogeochemical model to explicitly simulate ocean circulation and air-sea CO2 fluxes48
- Alternate approaches may be considered on a case by case basis, provided it is sufficiently described and justified in the PDD.
Option 1 assumes thermodynamic equilibrium with the atmosphere and provides an upper limit on the expected ocean losses. Option 2 considers the 3D ocean circulation and does not assume equilibrium with the atmosphere, which may lead to fewer losses in certain regions if the exported DIC is subducted out of atmospheric contact for long periods of time.
Option 1
The Renforth and Henderson (2017) uptake efficiency equation is14:
(Equation 16)
Where
- is the Renforth and Henderson uptake efficiency of CO2 upon mixing with ocean waters, in mol C/mol alkalinity;
- is the change in Total DIC in the ocean as a result of the project activity, in mol C;
- is the change in Total Alkalinity in the ocean as a result of the project activity, in mol alkalinity;
- is the local ocean partial pressure of CO2 at the discharge site, in μatm;
- is the local surface ocean temperature, in °C;
- is the local ocean salinity, in %.
Project Proponents should use the oceanographic conditions from publicly available, locationally-specific time-series data, such as the NOAA climate indices list, OceanSODA-ETHZ, or equivalent, to calculate the Renforth and Henderson uptake efficiency with Equation 16.
is in units of mol C/mol alkalinity and must be converted to a dimensionless retention factor , representing the fraction of CO2 retained upon discharge to the ocean.
If a non-carbonate feedstock is used, then can be converted by assuming that 1 mol CO2 is removed per mol alkalinity generated. However if a carbonate feedstock is used, then dissolution of the feedstock itself contributes to an increase in ocean DIC, and 1 mol of CO2 is removed per 2 mol alkalinity generated. An alternative formulation for the retention of atmospheric CO2 for carbonate feedstocks can be derived from Equation 6 in Bach (2024)30.
Thus, the fraction of CO2 retained upon ocean discharge is given by:
(Equation 17)
Where:
- is defined in Equation 16, in units of mol C/mol alkalinity
If a combination of carbonate and non-carbonate feedstocks are used, then a generalizable form of Equation 17 can be derived from Bach 202430
Option 2
An alternative approach to quantifying ocean losses is to use a 3D Earth Systems Model or ocean physical-biogeochemical model to explicitly simulate ocean transport and air-sea CO2 fluxes. For example, Kanzaki et al., 2023 used an Earth system model to estimate the ocean leakage of CO2 from terrestrial enhanced weathering projects48. Similar model-based approaches may be used, however the calculation of ocean losses must be regionally specific to the Project-site. A globally averaged loss factor may not be used at this time since it may not be conservative, given the large variability that exists in different regions of the ocean.
Projects Proponents must submit a detailed description of their modeling approach in the PDD, including the following:
- The model used and domain
- Inputs and forcing data, including atmospheric forcing and initial conditions
- Carbonate system representation and parameterization of air-sea CO2 fluxes
- Representation of the CDR project, e.g. as represented through an additional flux of DIC and alkalinity into the ocean at a particular river mouth
- Baseline simulations
Furthermore, the model must be well-validated and skillful for the purpose that it is used for. Proof of model validation can be achieved through either:
- A track record of use in science, industry, or government applications, which is demonstrated through multiple peer-reviewed papers, or proof of usage in a number of previous applications.
- Newly developed models without a track record of usage must be validated against reputable data sources, which include quality-controlled in situ measurements and public datasets adhering to FAIR (Findable, Accessible, Interoperable and Reusable) principles50. Sufficient model validation data must be provided with the PDD.
Calculation of CO2eCounterfactual,RP
is defined as the amount of inorganic carbon that would have been stored in the aqueous or solid phase as a result of passive weathering of the feedstock used, without project intervention, across a Credit lifetime. Project intervention refers to any active measures taken by the Project that accelerate or modify the natural weathering process, including extracting feedstock from its original location, processing it (crushing, grinding), placing it in engineered systems, and controlling environmental conditions beyond natural ambient levels. This Module defines the durability of a Credit as 1,000+ years. Thus, this is the default time scale when calculating . If additional information on the conditions and duration of feedstock storage are available, Project Proponents may justify calculating the counterfactual across a time period relevant to the specific mine or quarry from which the feedstock is sourced in the PDD. For example, if sufficient documentation exists suggesting that piles of waste materials generated by the feedstock supplier will not be exposed to ambient environmental conditions for a period exceeding 20 years, based on site-specific documentation such as mine closure plans, regulatory requirements, or expected site management practices, the counterfactual may be considered across a 20-year time span.
must be calculated by modeling the expected weathering rate of feedstock under storage conditions relevant to the source site for either 1,000 years or a time period justified in the PDD as described above. This must be justified by empirical data from subsamples of the feedstock; guidelines for sampling procedures that adequately capture feedstock heterogeneity are described in the Rock and Mineral Feedstock Characterization Module. Models must take into account:
- Feedstock mineralogy
- Feedstock surface area
- Environmental conditions of the source site, including:
- Temperature
- Average yearly precipitation
- Rainwater pH
- Groundwater pH
- Carbonate saturation
- Permeability
- Water saturation
The model used to calculate must be provided to Isometric and the Validation and Verification Bodies (VVB). Project Proponents may choose to either assume the total counterfactual as a one-time deduction during the first project Reporting Period, or to amortize the counterfactual deduction across all Reporting Periods within the Project lifetime.
Broader Impacts on CDR
Discharge of Undissolved Alkalinity
Any undissolved feedstock which is released in the effluent as total suspended solids (TSS) may dissolve in the open environment depending on local saturation states and enhance alkalinity in the receiving water body. This will result in increased pH, total alkalinity (TA), and potentially facilitate additional carbon uptake via air-sea gas exchange if the alkaline-enriched waters remain in contact in the atmosphere. Additional solids separation prior to discharge may be required to prevent release of undissolved feedstock to the open environment. It would be preferable that reactor design could incorporate appropriate filtration or solids separation systems to prevent discharge of undissolved feedstock. Separated solids may be recycled to the reactor for further processing or managed as waste/byproduct according to their chemical composition and applicable regulations. Projects which aim to discharge undissolved feedstock into the ocean and quantify open ocean CDR must refer to the Ocean Alkalinity Enhancement from Coastal Outfalls Protocol. Projects that wish to seek Credits under both this Module and the OAE Protocol must consult with Isometric ahead of time to establish clear boundaries between the Projects and ensure no potential double-counting.
Biological Fertilization
The release of elements (such as iron, silica, nitrogen and phosphorus) and DIC-enriched waters could lead to increases in primary production or changes in phytoplankton community structure, which may have a broader impact on biological carbon export. It is challenging to attribute additional primary production above the baseline scenario to the CDR intervention. For this reason, the potential impacts of increased primary production on carbon removal are not accounted for in this Module. Project Proponents must select alkaline feedstocks which minimize the risk of fertilization and ensure effluent concentrations of key nutrients comply with applicable regulatory frameworks including the EU Urban Waste Water Treatment Directive (91/271/EEC), Water Framework Directive (2000/60/EC), Habitats Directive (92/43/EEC) for Natura 2000 sites, UK Sites of Special Scientific Interest designations, and equivalent regulations in other jurisdictions. Nutrient sampling and analysis must follow established standard methods as outlined in relevant scientific literature and regulatory guidance51.
Monitoring Requirements for All Engineered Systems
Fluid Measurements
This Module requires that fluids are characterized at the point of fluid introduction (influent) and at the point of fluid exit from the system (effluent). Where applicable, analytical methods must be cross-referenced with an appropriate standard (e.g. ISO, EN, BSI, ASTM, EPA) or regulatory Protocol/methodology as required by relevant jurisdictional authorities. Where a Project utilizes a non-standardized methodology or SOP for the determination of a listed parameter, the Project Proponent is required to outline the relevant method within the Project Design Document (PDD) submitted to the VBB including demonstration of compliance with applicable regulatory requirements. Note that this Module does not prescribe specific measurement methods, though suggested methods are included. Novel measurement methods may be considered on a case-by-case basis. Further detail is given in Section 5.3.
Baseline Characterization
Project Proponents are required to characterize the pH range and the concentration of non-carbonic acid sources present in the water source used prior to commencement of project activities. This is to determine the potential risk of non-carbonic acid weathering in engineered enhanced weathering projects (see Section 4.1.3.1). Non-carbonic acid concentrations must be measured as major anions in the water source, including NO3-, Cl-, PO43-, SO42- and any other anions relevant to the specific fluid and feedstock used. Measurement methods should comply with ISO 10304-1:2007 or an equivalent national standard. If anion measurements are made on the influent by a partner facility (e.g. wastewater treatment plant, industrial facility), these values may be substituted for direct measurements. To conservatively calculate weathering that occurs as a result of non-carbonic acid, Project Proponents choosing to substitute this data for measurements must assume that all non-carbonic acid present in the fluid will react with feedstock.
The concentration of non-carbonic acid in the source fluid must be reported in the PDD. Project Proponents are strongly encouraged to calculate the expected losses related to non-carbonic acid and compare this value to the expected CO2 storage based on feedstock characteristics to ensure that the water source is suitable for the Project.
Depending on the source of the fluid, the pH and concentration of anions may display high temporal variability. Project Proponents using direct measurements must provide details of their baseline sampling plan and describe how the chosen sampling frequency is appropriate for capturing any significant variation in concentration in the water source. At minimum, baseline sampling plans should include:
- Sampling frequency that captures all applicable (e.g., seasonal) variations;
- Additional sampling during known high-variability periods (e.g., storm events, industrial discharge cycles);
- Statistical justification for sampling frequency based on preliminary variability assessment;
- Contingency sampling Protocols if initial results show higher variability than expected.
For water sources with well-documented historical data, Project Proponents may justify reduced sampling frequencies by demonstrating that existing data adequately characterises temporal variability.
Carbonic Acid System
This Module requires direct monitoring of the carbonic acid system to verify aqueous storage of CO2. To adequately constrain the carbonic acid system within the engineered reactor, sampling should be conducted at the influent point before water enters the reactor and at the effluent point immediately after water exits the reactor, prior to discharge. Project Proponents are required to measure at least three of the following parameters in both the influent and effluent fluids:
- pH (via direct measurement - [ISO 10523:2008])
- Alkalinity (sampling & measurement via titration – for freshwater, ISO 9963-1:1994 may be used; for brackish or seawater, a high-precision method such as open-cell potentiometric or Gran titration following established oceanographic Protocols is required)
- Dissolved Inorganic Carbon (DIC; Sampling & measurement via acid titration or infrared detection)
- pCO2 (via in-line sensor or headspace equilibration and gas chromatography)
Three components of the carbonic acid system are required due to the high CO2 concentration within the reactor, which is likely to drive outgassing of CO2 during sample collection and analysis. To reduce uncertainty in carbonic acid system calculations, it is highly recommended to measure all four of these parameters where possible52 53 54. Bicarbonate (HCO3−) and carbonate (CO32−) can then be calculated using the two-for-six method, which is commonly accomplished using PHREEQC (typically used for freshwater) software55. While PHREEQC does not inherently propagate uncertainties in forward modeling, measuring multiple parameters provides a more robust dataset for modeling and analysis. PHREEQC is used to validate that enhanced weathering processes within the reactor are proceeding as expected and does not include modeling the fate of CO2 after effluent discharge to the receiving water body. Project Proponents are required to submit data for all parameters of the carbonic acid system, both measured and calculated; where calculations were performed using methods other than PHREEQC, Project Proponents are required to submit the script or spreadsheet where the calculations were made.
Due to the high CO2 concentrations in reactor streams, it is critical that samples are stored properly and analyzed as soon after collection as possible to mitigate any potential re-equilibration of the carbonic acid system. Samples must be stored in refrigerated conditions without headspace in sealed vials. Sample collection procedures and sample storage conditions must be described in the PDD. Where possible, measurement via in-line sensors is highly recommended. Where in-line sensors are installed, Project Proponents are required to report calibration data and frequency, fluid flow paths through the sensor, and measurement error (as determined by measurement of standards).
As part of reporting carbonic acid system measurements, Project Proponents must describe in detail the point at which concentrated CO2 is introduced to the system, whether it is dissolved in water prior to introduction into the reactor or if it is introduced into the reactor directly via bubbling or similar. Where possible, the CO2 concentration of the influent(water) should be measured directly. Where this is not possible (e.g. in instances where CO2 is introduced to the reactor directly), Project Proponents must calculate a conservative estimate of CO2 concentration using the concentration of the CO2 stream, the reactor volume, and the partial pressure of CO2 in the reactor. All calculations must be described and reported in the PDD.
Turbidity/Total Suspended Solids
Project Proponents are required to monitor feedstock losses from the system. Risk of feedstock loss may be higher depending on the reactor system, such as fluidized bed reactors. It is recommended that Project Proponents design reactor systems to minimize feedstock losses, such as installing filters or recirculating feedstock into the reactor system. Feedstock losses should be monitored using turbidity/total suspended solids sensors installed at the influent and effluent points. Alternate methods of quantifying feedstock loss may be appropriate and must be described and justified in the PDD.
Major and Trace Elements
This Module requires a full suite of elemental analyses in influent and effluent samples. Fluid samples must be analyzed by either inductively coupled plasma mass spectrometry (ICP-MS; [ISO 17294-1:2004]) or inductively coupled plasma optical emission spectroscopy (ICP-OES; [ISO 11885:2007]) as the primary determination method. Other high-precision analytical methods such as ion chromatography (IC) is also acceptable for the quantification of major cations. Project Proponents should take analytical precision and detection limits into account when determining their measurement method. Project Proponents are required to describe their measurement methods in the PDD. When reporting data from ICP-MS/OES, Project Proponents must include information on calibration standards, blanks, and geostandards; requirements for data reports are described in the Rock and Mineral Feedstock Characterization Module.
System Measurements
As outlined in Section 2.4, measurements of flow rate, temperature, pressure, and/or pH inside the reactor at one or more locations (depending on the reactor type) may be required for (i) characterization of loss of CO2 due to leakage from the reactor, and/or (ii) as part of a maintenance plan to ensure reactor integrity in terms of thermal, mechanical, or corrosive containment failures. Measurement methods to determine temperature should comply with the ASTM Temperature Measurement Standards, or an equivalent standard in the region of operation. Measurement methods to determine pressure should comply with ASME 19.2-2010, or an equivalent standard in the region of operation. Measurement methods to determine pH should comply with ASTM E70-19, or an equivalent standard in the region of operation. Reactor modeling conducted for quantification of CO2 loss due to leakage from the reactor must follow best practice reactor modeling principles. Owing to the variety of valid approaches which could be used to accurately model the performance of a given chemical reactor, justification of the chosen reactor model formulation should be supplied in the PDD.
Verification of Novel Measurement Methods
Novel measurement methods may be permissible for quantification of any parameter and will be examined on a case-by-case basis. To be eligible, Project Proponents must demonstrate that the novel measurement technique performs within error of conventional methods for all system variation that can be expected under normal operational conditions. This Module considers 'within error' as the more conservative of 3 standard deviations from the mean or an error margin of 5%. When system variability is well-characterized, Project Proponents may choose to perform this comparison at intervals that reflect the full variability of the system. If this is not possible, due to high variability or lack of system characterization, this comparison must be performed, at a minimum, across a full Reporting Period with sufficient frequency to capture the full range of operational conditions encountered throughout the Reporting Period. System variability characterization must include the following parameters:
- The parameter targeted by the novel measurement technique
- Operational temperature
- Operational pressure
- Flow rate
- pH
Monitoring Requirements for Receiving Waters
The aims of monitoring in receiving waters are to demonstrate permit compliance, monitor environmental conditions, conduct ongoing monitoring for quantification of downstream losses, and establish processes for adaptive management to ensure that Project activities are stopped if negative impacts are identified.
All measurements in receiving waters are recommended. The receiving waters monitoring plan should span the general locations listed below. Project Proponents are responsible for determining appropriate site-specific monitoring locations. A diagram of the monitoring locations, including the location in the water column, must be included in the monitoring plan submitted in the PDD.
Mixing Zone
The area where initial dilution takes place is often called the mixing zone (or "a reasonable mixing zone" or "zone of initial dilution"), typically on the scale of ~100m, depending on the scale of discharge. A mixing zone is a regulatory concept, which describes a spatial area surrounding the discharge infrastructure where water quality criteria can be exceeded. Permits which allow for a mixing zone require water quality criteria to be met at the edge of a mixing zone. A mixing zone is a simplified representation of initial mixing of discharge with receiving waters, the true spatial extent of this mixing changes dynamically with environmental conditions.
Detection of a measurable signal may be difficult beyond the mixing zone, especially for small-scale deployments. Beyond the mixing zone, receiving waters are expected to be well-mixed, which can provide more representative measurements of the impact of the discharge. Thus, environmental monitoring should be focused on the edge of the mixing zone. However, monitoring at multiple locations provides valuable information, including at the discharge point to characterize direct system output, within the mixing zone to capture dilution gradients, and at the edge of the mixing zone for regulatory compliance. The edge of the mixing zone remains the primary monitoring location as this is where water quality criteria must be met.
It is recommended that Project Proponents monitor temperature, salinity, at least two carbonate chemistry parameters (pH, TA, DIC, pCO₂), dissolved oxygen (DO), turbidity and total suspended solids (TSS) at the edge of the mixing zone. Temperature and salinity are necessary for determining physical conditions, and should be co-located with other measured quantities. Two carbonate chemistry parameters (pH, TA, DIC, pCO₂) can be used to characterize the carbonate system. It is a known limitation of using pH and pCO₂ measurements to constrain the full carbonate system that uncertainty can be high46. It is therefore recommended a third carbonate system measurement is collected and measured to constrain the full carbonate system (including the state of carbonate disequilibrium) and recalibrate autonomous sensors. DO, turbidity and TSS are water quality indicators. Action thresholds are placed on pH, TSS and DO (see Section 11.3.3). Monitoring of Chl-a and dissolved inorganic nutrients, as well as any other site-specific parameters suggested by regulators, is also recommended.
Biological and Ecological Monitoring in Deployment Area
Identification of site-specific biological and ecological monitoring requirements must be determined by conducting an environmental risk assessment.
Project Proponents are recommended to conduct periodic ecological surveys to monitor phytoplankton community abundance and composition, benthic community abundance and diversity and presence and potential interactions with species of special concern (IUCN listed, commercially exploited or keystone species). Functional diversity should be considered in addition to taxonomic diversity. Survey sites should include the immediate vicinity of the discharge pipe and specific benthic habitats within the affected area of the project activities to be identified and determined on a site-by-site basis.
Action thresholds are not imposed on ecological indicators due to the difficulty of establishing ecological baselines and attributing ecological changes. Data collection remains imperative for establishing a foundation for future analysis and enabling the assessment of cumulative impacts of Enhanced Weathering, including assessing co-benefits and restoration impacts. Ecological data must be made publicly available, and the location of where data is stored publicly must be included in the PDD.
Monitoring for Ecosystem Safety
Thresholds on environmental monitoring parameters are used to determine safe limits for discharge, mitigate environmental risks and identify negative environmental impact.
Two types of thresholds are used:
- Safety thresholds are imposed on the effluent characteristics and controlled prior to discharge.
- Action thresholds are measured at the edge of the mixing zone. Parameters measured are indicators of water quality and/or unintended environmental changes. Action thresholds can be absolute or relative, and can be determined by regulatory limits, relative to natural variability based on historical data or relative to a control site. For example, the action threshold on pH could be 6.5 < pH < 9 or ±0.2 relative to natural variability, whichever is more conservative. Action thresholds may vary seasonally, and should be consistent with monitoring requirements under official permitting.
Effective implementation of these measures must also be accompanied by a robust monitoring plan to detect negative impacts and stop projects when necessary.
Threshold Violations
Violations are determined based on the threshold type, and specifics of the site, permit and intended activities. For example, breaches of safety thresholds may be determined by daily mean or max values and breaches of action thresholds in the mixing zone may be determined by weekly and/or monthly mean or max values. All violations need to be reported, and gaps in ocean monitoring data must be justified.
Enforcement Actions
Credits cannot be issued for time periods without sufficient measurements to demonstrate compliance with action and safety thresholds. The handling of data gaps must be reported in the PDD. Removal activity from discharges that occur during time periods of safety threshold violations will not be eligible for crediting. Action threshold violations must trigger adaptive management plans. Failure to adequately address environmental risks or remediate any harm will lead to a project being subject to Credit cessation.
Storage
The long term storage reservoir of removed carbon is as Dissolved Inorganic Carbon (DIC) in the ocean. The durability and reversal risks of this storage reservoir are discussed in the DIC Storage in Oceans Module.
Data Sharing and Transparency
In accordance with Section 3.8 of the Isometric Standard, it is a requirement of this Module that all data associated with quantification of is hosted publicly on the Isometric registry. This includes all measurements that directly feed into the equation terms listed in Section 4. While it is required to measure and report redundant data that is collected to resolve the mass balance of a system to Isometric, it is not a requirement to make this data public. Further clarity on which measurements will be publicly shared is given in Appendix 1.
Contributors
- Ella Holme, Ph.D.
- Kevin Sutherland, Ph.D.
- Jennifer Yin, Ph.D.
- Jing He, Ph.D.
- Xueya Lu, Ph.D.
- Chris Pollard
Definitions and Acronyms
- ActivityThe steps of a Project Proponent’s Removal process that result in carbon fluxes. The carbon flux associated with an activity is a component of the Project Proponent’s Protocol.
- BaselineA set of data describing pre-intervention or control conditions to be used as a reference scenario for comparison.
- BiodiversityThe diversity of life across taxonomic and spatial scales. Biodiversity can be measured within species (i.e. genetic diversity and variations in allele frequencies across populations), between species (i.e. the total number and abundance of species within and across defined regions), within ecosystems (i.e. the variation in functional diversity, such as guilds, life-history traits, and food-webs), and between ecosystems (variation in the services of abiotic and biotic communities across large, landscape-level scales) that support ecoregions and biomes.
- Carbon Dioxide Equivalent Emissions (CO₂e)The amount of CO₂ emissions that would cause the same integrated radiative forcing or temperature change, over a given time horizon, as an emitted amount of GHG or a mixture of GHGs. One common metric of CO₂e is the 100-year Global Warming Potential.
- Carbon Dioxide Removal (CDR)Activities that remove carbon dioxide (CO₂) from the atmosphere and store it in products or geological, terrestrial, and oceanic Reservoirs. CDR includes the enhancement of biological or geochemical sinks and direct air capture (DAC) and storage, but excludes natural CO₂ uptake not directly caused by human intervention.
- ConservativePurposefully erring on the side of caution under conditions of Uncertainty by choosing input parameter values that will result in a lower net CO₂ Removal than if using the median input values. This is done to increase the likelihood that a given Removal calculation is an underestimation rather than an overestimation.
- CounterfactualAn assessment of what would have happened in the absence of a particular intervention – i.e., assuming the Baseline scenario.
- CreditA publicly visible uniquely identifiable Credit Certificate Issued by a Registry that gives the owner of the Credit the right to account for one net metric tonne of Verified CO₂e Removal. In the case of this Standard, the net tonne of CO₂e Removal comes from a Project Validated against a Certified Protocol.
- Direct Ocean Capture and Storage (DOCS)A carbon removal pathway that captures and durably stores carbon from seawater, which induces additional uptake of atmospheric carbon dioxide in the ocean.
- Dissolved Inorganic Carbon (DIC)The concentration of inorganic carbon dissolved in a fluid.
- Double CountingImproperly allocating the same Removal from a Project Proponent more than once to multiple Buyers.
- DurabilityThe amount of time carbon removed from the atmosphere by an intervention – for example, a CDR project – is expected to reside in a given Reservoir, taking into account both physical risks and socioeconomic constructs (such as contracts) to protect the Reservoir in question.
- Ecosystem FunctionThe natural processes and interactions that occur within an ecosystem, including the flow of energy and materials through biotic and abiotic components, encompassing activities like nutrient cycling, primary production, and habitat provision, which collectively maintain the balance and stability of the ecosystem.
- EmissionsThe term used to describe greenhouse gas emissions to the atmosphere as a result of Project activities.
- Enhanced Weathering (EW)A carbon removal pathway that accelerates the natural chemical weathering process of alkaline rocks or minerals by pre-processing such as crushing or grinding.
- EstuaryThe stretch of tidally influenced river where the river and ocean meet. In this protocol, this region is bounded by the head of tide and the seaward limit of estuarine influence in the ocean.
- FeedstockRaw material which is used for CO₂ Removal.
- Greenhouse Gas (GHG)Those gaseous constituents of the atmosphere, both natural and anthropogenic (human-caused), that absorb and emit radiation at specific wavelengths within the spectrum of terrestrial radiation emitted by the Earth’s surface, by the atmosphere itself, and by clouds. This property causes the greenhouse effect, whereby heat is trapped in Earth’s atmosphere (CDR Primer, 2022).
- ICP-MSInductively Coupled Plasma Mass Spectrometry: An analytical technique used to measure elements at trace levels within a sample.
- ICP-OESInductively Coupled Plasma Optical Emission Spectroscopy: An analytical technique used to measure elements at trace levels within a sample.
- International Standards Organization (ISO)A worldwide federation (NGO) of national standards bodies from more than 160 countries, one from each member country.
- LeakageThe increase in GHG emissions outside the geographic or temporal boundary of a project that results from that project's activities.
- Lossesfor open systems, biogeochemical and/or physical interactions which occur during the removal process that decrease the CO₂ removal .
- Mixing ZoneA regulatory concept describing the spatial area surrounding the discharge infrastructure where water quality criteria can be exceeded.
- ModelA calculation, series of calculations or simulations that use input variables in order to generate values for variables of interest that are not directly measured.
- ModuleIndependent components of Isometric Certified Protocols which are transferable between and applicable to different Protocols.
- PSDParticle size distribution.
- ProjectAn activity or process or group of activities or processes that alter the condition of a Baseline and leads to Removals.
- Project Design DocumentThe document, written by a Project Proponent, which records key characteristics of a Project and which forms the basis for Project Validation and evaluation in accordance with the relevant Certified Protocol. (Also known as “PDD”).
- Project Design Document (PDD)The document that clearly outlines how a Project will generate rigorously quantifiable Additional high-quality Removals.
- Project ProponentThe organization that develops and/or has overall legal ownership or control of a Removal Project.
- RPReporting Period
- RegistryA database that holds information on Verified Removals based on Protocols. Registries Issue Credits, and track their ownership and Retirement.
- RemovalThe term used to represent the CO₂ taken out of the atmosphere as a result of a CDR process.
- ReservoirA location where carbon is stored. This can be via physical barriers (such as geological formations) or through partitioning based on chemical or biological processes (such as mineralization or photosynthesis).
- ReversalThe escape of CO₂ to the atmosphere after it has been stored, and after a Credit has been Issued. A Reversal is classified as avoidable if a Project Proponent has influence or control over it and it likely could have been averted through application of reasonable risk mitigation measures. Any other Reversals will be classified as unavoidable.
- River mouthThe location where the river meets the ocean. In this protocol, the river mouth is defined as the head of tide, where tidal effects begin to influence the river’s flow.
- SinkAny process, activity, or mechanism that removes a greenhouse gas, a precursor to a greenhouse gas, or an aerosol from the atmosphere.
- SourceAny process or activity that releases a greenhouse gas, an aerosol, or a precursor of a greenhouse gas into the atmosphere.
- StorageDescribes the addition of carbon dioxide removed from the atmosphere to a reservoir, which serves as its ultimate destination. This is also referred to as “sequestration”.
- TICTotal Inorganic Carbon.
- Total AlkalinityDefined as an excess of proton acceptors over proton donors, which functionally describes the ability of a solution to neutralize acids to the CO₂ equivalence point.
- UncertaintyA lack of knowledge of the exact amount of CO₂ removed by a particular process, Uncertainty may be quantified using probability distributions, confidence intervals, or variance estimates.
- ValidationA systematic and independent process for evaluating the reasonableness of the assumptions, limitations and methods that support a Project and assessing whether the Project conforms to the criteria set forth in the Isometric Standard and the Protocol by which the Project is governed. Validation must be completed by an Isometric approved third-party (VVB).
- Validation and Verification Bodies (VVBs)Third-party auditing organizations that are experts in their sector and used to determine if a project conforms to the rules, regulations, and standards set out by a governing body. A VVB must be approved by Isometric prior to conducting validation and verification.
- VerificationA process for evaluating and confirming the net Removals for a Project, using data and information collected from the Project and assessing conformity with the criteria set forth in the Isometric Standard and the Protocol by which it is governed. Verification must be completed by an Isometric approved third-party (VVB).
- Waste productAn output of a process that has no intended value to the producer.
Appendix 1: Monitoring Requirements
Table A1-1: Closed System Monitoring Requirements
| Parameter | Rationale | Possible Measurement Technique/Standards | Requirements | Acceptable Data Sources | Public on registry/Private | |
|---|---|---|---|---|---|---|
| Fluid Measurements | pH | One component of the carbonic acid system, used to calculate the concentration of dissolved CO2 in a fluid. Note that at least 2 components of the carbonic acid system must be directly measured. | In-line pH sensor Discrete pH measurements | Required for influent and effluent samples | Direct measurement or calculation using a 2 for 6 model | Public |
| Dissolved Inorganic Carbon (DIC) | One component of the carbonic acid system, used to calculate the concentration of dissolved CO2 in a fluid. Note that at least 2 components of the carbonic acid system must be directly measured. | Total carbon analyzer | Required for influent and effluent samples | Direct measurement or calculation using a 2 for 6 model | Public | |
| Total Alkalinity | One component of the carbonic acid system, used to calculate the concentration of dissolved CO2 in a fluid. Note that at least 2 components of the carbonic acid system must be directly measured. | Titration | Required for influent and effluent samples | Direct measurement or calculation using a 2 for 6 model | Public | |
| pCO2 | One component of the carbonic acid system, used to calculate the concentration of dissolved CO2 in a fluid. Note that at least 2 components of the carbonic acid system must be directly measured. | In-line pCO2 sensor Headspace equilibration + gas chromatography | Required for influent and effluent samples | Direct measurement or calculation using a 2 for 6 model | Public | |
| Turbidity | Determination of rock or mineral feedstock loss | Turbidity sensor | Required for influent and effluent samples for projects in which rock or mineral feedstock may be lost from the system due to fluid flow | Direct measurement | Private | |
| Total Suspended Solids | Determination of rock or mineral feedstock loss | Total suspended solids sensor Filtration test | Required for influent and effluent samples for projects in which rock or mineral feedstock may be lost from the system due to fluid flow | Direct measurement | Private | |
| Major and trace elements | Determination of weathering by mass balance Determination of trace metal concentrations for regulatory compliance | ICP-MS ICP-OES | Required for influent and effluent samples | Direct measurement | Public | |
| Anions | Determination of strong acid concentration | Ion chromatography | Required for baseline samples | Direct measurement Regulatory data may be substituted if available | Private | |
| Electrical conductivity | Can serve as an additional parameter in 2 for 6 calculations to reduce uncertainty | In-line conductivity sensor | Recommended for baseline, influent and effluent samples | Direct measurement | Private | |
| System Measurements | Pressure | Reactor performance monitoring | Pressure gauge | Required in reactors; variable based on reactor type | Direct measurement | Private |
| Temperature | Reactor performance monitoring Calculation of reaction kinetics | In-line thermometer | Required in reactors; variable based on reactor type | Direct measurement | Private | |
| Flow rate | Reactor performance monitoring Chemical reactor model input | Flow meter | Required in reactors; variable based on reactor type | Direct measurement | Private | |
| Feedstock Measurements | Mineralogy | Assessment of CDR potential and environmental risk | X-ray diffraction (XRD) Scanning electron microscopy (SEM) | Required prior to and following carbonation | Direct measurement | Public |
| Major and trace elements | Assessment of CDR potential and environmental risk | Acid digestion coupled with ICP-MS Acid digestion coupled with ICP-OES X-ray fluorescence (XRF) | Required prior to and following carbonation | Direct measurement | Private | |
| Particle Size Distribution | Reaction rate and chemical reactor modeling | Gravimetric sieving Laser diffraction X-ray scattering | Required prior to and following carbonation | Direct measurement | Private | |
| Surface Area | Reaction rate modeling | Brunauer Emmett Teller (BET) analysis | Required prior to and following carbonation | Direct measurement | Private | |
| Total Inorganic Carbon (TIC) | Determination of carbonation | Thermogravimetric analysis (TGA) | Required prior to and following carbonation | Direct measurement | Public |
Table A1-2: Receiving Waters Monitoring Requirements
| Location | Parameter | Requirement Scope | Reason for Measurement | Methods | Frequency |
|---|---|---|---|---|---|
| Receiving waters, i.e. edge of mixing zone | Temperature | Recommended for all projects | Recommended for determining physical conditions and making calculations to fully constrain the seawater carbonate system | Sensor | (a) at high frequency when ramp-up is occurring and shortly after any operational changes are made, (b) with low frequency when the operations are occurring at a steady state |
| Salinity | Recommended for all projects | Recommended for determining physical conditions and making calculations to fully constrain the seawater carbonate system | Sensor | ||
Any two carbonate system paramters: pH, DIC, TA, pCO2 | Recommended for all projects | Recommended to constrain the seawater carbonate system, monitor water quality and local carbonate saturation state | Sensor (for pH or pCO₂) or discrete bottle samples | ||
| Third carbonate system parameter | Recommended for all projects | Recommended to assess the local state of carbonate disequilibrium | Sensor (for pH or pCO₂) or discrete bottle samples | ||
| Dissolved Oxygen (DO) | Recommended for all projects | Recommended as indicator of general ecosystem health | Sensor | ||
| Total Suspended Solids (TSS) | Recommended for all projects | Recommended for monitoring water quality and for mitigation of losses | Discrete bottle samples and filtering directly onto pre-weighed filter and subsequent measurement of mass change through drying (for example, in an oven) or derived from turbidity measurements with routine validation from bottle samples | ||
| Turbidity | Recommended for all projects | Recommended as part of ecosystem monitoring because elevated turbidity can impact photosynthesis and benthic ecosystem health | Sensor or discrete water sample | ||
| Chlorophyll-a | Recommended for all projects | Recommended as an indicator of general ecosystem health (phytoplankton primary productivity) | Sensor or discrete water sample | ||
| Dissolved inorganic nutrients | Recommended for all projects | Recommended as an indicator of general ecosystem health (available nutrients for primary productivity) and nutrient limitation impacts from secondary precipitation. | In situ sensor or discrete water sample via mooring or routine boat sampling | ||
| Deployment area | Plankton community | Recommended for all projects, may be required as part of project-specific environmental risk mitigation strategy | Recommended periodically for monitoring of ecosystem health, documentation of shifting baseline ecology and contributions to primary research | Plankton tow or other methods | At agreed upon intervals, before, during and after deployment |
| Benthic community | Recommended for all projects, may be required as part of project-specific environmental risk mitigation strategy | Recommended periodically for monitoring of ecosystem health, documentation of shifting baseline ecology and contributions to primary research Recommended for water and tissue samples in keystone biological species to track potential trace and heavy metal accumulation | Benthic survey or other methods |
Appendix 2: Project Design Document Requirements
Table A2-1: Summary Of Information Required in PDD
| Reactor Design | Parameter | Documentation Required | Requires justification | Other Requirements |
|---|---|---|---|---|
| Reactor Design | Reactor Type | Engineering Design Diagram | Yes | |
| Materials Selection | Engineering Design Diagram | Yes | ||
| Sensor Positioning | Engineering Design Diagram | Yes | ||
| CO2 Introduction Point | Engineering Design Diagram | Yes | ||
| Reactor modeling calculations | Chemical reactor model | Yes | If in-house experimental measurements are used to derive chemical kinetics, experimental procedures and measurements must be provided | |
| Reactor maintenance plan | Documentation detailing the maintenance plan | Yes | ||
| Feedstock | Requirements detailed in the Rock and Mineral Feedstock Characterization Module | |||
| Feedstock Pre-treatment, if used | Pre-treatment Method | Pre-treatment plan | Yes | Standard method or laboratory SOP must be provided |
| Physical and chemical characteristics of feedstock after pre-treatment | Data report, including particle size distribution, surface area, and total inorganic carbon | No | Methods used for feedstock characterization must be provided | |
| Counterfactual | Model timescale | Counterfactual weathering model | Yes | If using a timescale other than the default of 1000 years, documentation must be provided to support the timescale claimed. |
| Source site temperature | Data report | No | ||
| Source site average yearly precipitation | Data report, generated either by rain gauges installed by the Project Proponent or sourced from a weather station | Yes – justification of data source | ||
| Source site average rainwater pH | Data report, generated either by direct measurements by the Project Proponent or sourced from a weather station | Yes – justification of data source | ||
| Source site average groundwater pH | Data report, generated either from direct measurements by the Project Proponent or sourced from a groundwater database | Yes – justification of data source | ||
| Measurements | All measurements listed in Appendix 1 must be reported in the PDD | Data report | Yes, where alternate methods than those listed are used | Standard and calibration data must be provided alongside measurements. All standards or SOPs used for measurements must be provided. |
| Carbonic acid system calculations | Data report and calculations used (spreadsheet, script) | No | ||
| Sampling | Feedstock sampling plan and procedure | See guidance in the Rock and Mineral Feedstock Characterization Module | Yes | Sampling plans should be provided for raw feedstock, carbonated feedstock, and pre-treated feedstock (if applicable) |
| Fluid sampling plan and procedure | Detailed description of fluid sampling, both temporally and spatially, and the sampling procedure | Yes | ||
| Aqueous sample storage | Detailed description of storage conditions for aqueous samples | Yes | ||
| Miscellaneous | Any significant but allowable deviation from the requirements outlined in this Module, as approved in consultation with Isometric | Detailed documentation appropriate to the deviation | Yes |
Appendix 3: Measurement Frequency
Table A3-1: Closed System Measurement Frequencies
| Parameter | Measurement Frequency | Rationale | |
|---|---|---|---|
| Fluid Measurements | pH | Continuous or pre-defined time steps | pH can be continuously monitored through in-line pH sensors. Discrete pH measurements should be taken at regular intervals to confirm the functionality of in-line sensors. The sampling cadence will be determined by reactor type and flow rate. |
| Dissolved Inorganic Carbon | Pre-defined time steps | Sampling cadence will be determined by the reactor type and flow rate. This must be temporally consistent with other measurements of the carbonic acid system (e.g. tied to a time on continuous sensor output or taken from a volume of fluid collected at the same sampling interval). | |
| Total Alkalinity | Pre-defined time steps | Sampling cadence will be determined by the reactor type and flow rate. This must be temporally consistent with other measurements of the carbonic acid system (e.g. tied to a time on continuous sensor output or taken from a volume of fluid collected at the same sampling interval). | |
| pCO2 | Continuous or pre-defined time steps | pCO2 can be monitored continuously through in-line pCO2 sensors. Where in-line pCO2 sensors cannot be installed, discrete measurements may be substituted. Sampling cadence will be determined by the reactor type and flow rate. This must be temporally consistent with other measurements of the carbonic acid system (e.g. tied to a time on continuous sensor output or taken from a volume of fluid collected at the same sampling interval). | |
| Turbidity | Continuous | Turbidity can be monitored continuously through in-line turbidity sensors. | |
| Total Suspended Solids | Continuous or pre-defined time intervals | Total suspended solids can be monitored continuously through in-line suspended solids sensors. Discrete measurements can be substituted for in-line measurements. Project Proponents choosing to monitor TSS through discrete measurements must justify the time intervals of measurement based on reactor type, flow rate through the reactor and particle size distribution of the feedstock. | |
| Major and trace elements | Pre-defined time intervals | Measurement of major and trace elements requires discrete sampling. Sampling cadence will be determined by the reactor type and flow rate. This must be temporally consistent with sampling for other geochemical measurements. | |
| Anions | Baseline and pre-defined time intervals | Anion measurements are required for baseline fluids and at regular intervals if a strong risk of non-carbonic acid weathering is identified. Measurement of anions requires discrete sampling. Sampling cadence for applicable projects will be determined by the reactor type and flow rate. This must be temporally consistent with sampling for other geochemical measurements. | |
| Electrical Conductivity | Continuous or pre-defined time intervals | Electrical conductivity can be measured continuously using in-line conductivity sensors. Project Proponents choosing to measure electrical conductivity may also use discrete measurements. Sampling cadence will be determined by the reactor type and flow rate. This must be temporally consistent with sampling for other geochemical measurements. | |
| System Measurements | Pressure | Continuous | Pressure should be measured continuously by an in-line pressure gauge. |
| Temperature | Continuous | Temperature should be measured continuously by an in-line thermometer. | |
| Flow Rate | Continuous | Flow rate should be measured continuously by an in-line flow meter. | |
| Feedstock Measurements | Mineralogy | Prior to and following carbonation, as well as following any feedstock pre-treatment | Mineralogy of the feedstock must be constrained prior to and following carbonation to inform the conditions of pre-treatment (if applicable), reactor conditions and mineral storage conditions. |
| Major and Trace Elements | Prior to and following carbonation | Geochemical composition of the feedstock must be constrained prior to and following carbonation to inform the conditions of pre-treatment (if applicable), reactor conditions and mineral storage conditions. | |
| Particle Size Distribution | Prior to and following carbonation, as well as following any feedstock pre-treatment | Particle size distribution of the feedstock must be constrained prior to and following carbonation to inform the conditions of pre-treatment (if applicable), reactor conditions and mineral storage conditions. | |
| Surface Area | Prior to and following carbonation, as well as following any feedstock pre-treatment | Surface area of the feedstock must be constrained prior to and following carbonation to inform the conditions of pre-treatment (if applicable), reactor conditions and mineral storage conditions. | |
| Total Inorganic Carbon (TIC) | Prior to and following carbonation, as well as following any feedstock pre-treatment | TIC of the feedstock must be constrained prior to and following carbonation to inform the conditions of pre-treatment (if applicable), reactor conditions and mineral storage conditions, as well as to ensure accurate accounting of carbon storage. |
Relevant Works
Footnotes
-
Gaillardet, J., Dupré, B., Louvat, P., & Allègre, C. J. (1999). Global silicate weathering and CO₂ consumption rates deduced from the chemistry of large rivers. Chemical Geology, 159(1-4), 3-30. ↩
-
Renforth, P. (2012). The potential of enhanced weathering in the UK. International Journal of Greenhouse Gas Control, 10, 229-243. ↩ ↩2
-
Kantola, I. B., Blanc-Betes, E., Masters, M. D., Chang, E., Marklein, A., Moore, C. E., von Haden, A., Bernacchi, C. J., Wolf, A., Epihov, D. Z., Beerling, D. J., & DeLucia, E. H. (2023). Improved net carbon budgets in the US Midwest through direct measured impacts of enhanced weathering. Global Change Biology, 7012-7028. ↩
-
Beerling, D. J., Kantzas, E. P., Lomas, M. R., Wade, P., Eufrasio, R. M., Renforth, P., ... & Banwart, S. A. (2020). Potential for large-scale CO2 removal via enhanced rock weathering with croplands. Nature, 583(7815), 242-248. ↩
-
Reershemius, T., Kelland, M. E., Jordan, J. S., Davis, I. R., D’Ascanio, R., Kalderon-Asael, B., ... & Planavsky, N. J. (2023). Initial validation of a soil-based mass-balance approach for empirical monitoring of enhanced rock weathering rates. Environmental Science & Technology, 57(48), 19497-19507. ↩
-
Montserrat, F., Renforth, P., Hartmann, J., Leermakers, M., Knops, P., & Meysman, F. J. (2017). Olivine dissolution in seawater: implications for CO2 sequestration through enhanced weathering in coastal environments. Environmental science & technology, 51(7), 3960-3972. ↩
-
Meysman, F. J., & Montserrat, F. (2017). Negative CO2 emissions via enhanced silicate weathering in coastal environments. Biology Letters, 13(4), 20160905. ↩
-
Rau, G. H., Knauss, K. G., Langer, W. H., & Caldeira, K. G. (2004). CO2 mitigation via accelerated limestone weathering (No. UCRL-PROC-203556). Lawrence Livermore National Lab.(LLNL), Livermore, CA (United States). ↩ ↩2
-
Rau, G. H., Knauss, K. G., Langer, W. H., & Caldeira, K. (2007). Reducing energy-related CO2 emissions using accelerated weathering of limestone. Energy, 32(8), 1471-1477. ↩
-
Xing, L., Darton, R. C., & Yang, A. (2021). Enhanced weathering to capture atmospheric carbon dioxide: Modeling of a trickle‐bed reactor. AIChE Journal, 67(5), e17202. ↩ ↩2
-
Xing, L., Pullin, H., Bullock, L., Renforth, P., Darton, R. C., & Yang, A. (2022). Potential of enhanced weathering of calcite in packed bubble columns with seawater for carbon dioxide removal. Chemical Engineering Journal, 431, 134096. ↩
-
Köhler, P., Hartmann, J., & Wolf-Gladrow, D. A. (2010). Geoengineering potential of artificially enhanced silicate weathering of olivine. Proceedings of the National Academy of Sciences, 107(47), 20228-20233. ↩
-
Dessert, C., Dupré, B., Gaillardet, J., François, L. M., & Allègre, C. J. (2003). Basalt weathering laws and the impact of basalt weathering on the global carbon cycle. Chemical Geology, 202(3-4), 257-273. ↩
-
Renforth, P., & Henderson, G. (2017). Assessing ocean alkalinity for carbon sequestration. Reviews of Geophysics, 55(3), 636-674. ↩ ↩2 ↩3
-
Pokrovsky, O. S., & Schott, J. (2002). Surface chemistry and dissolution kinetics of divalent metal carbonates. Environmental Science & Technology, 36(3), 426-432. ↩
-
Golubev, S. V., Pokrovsky, O. S., & Schott, J. (2005). Experimental determination of the effect of dissolved CO₂ on the dissolution kinetics of Mg and Ca silicates at 25 C. Chemical Geology, 217(3-4), 227-238. ↩
-
Martinez, R. E., Weber, S., & Bucher, K. (2014). Quantifying the kinetics of olivine dissolution in partially closed and closed batch reactor systems. Chemical Geology, 367, 1-12. ↩
-
Allen, G. H., David, C. H., Andreadis, K. M., Hossain, F., & Famiglietti, J. S. (2018). Global estimates of river flow wave travel times and implications for low-latency satellite data. Geophysical Research Letters, 45, 7551–7560. https://doi.org/10.1029/2018GL077914 ↩ ↩
-
Maroto-Valer, M. M., Fauth, D. J., Kuchta, M. E., Zhang, Y., & Andrésen, J. M. (2005). Activation of magnesium rich minerals as carbonation feedstock materials for CO2 sequestration. Fuel Processing Technology, 86(14-15), 1627-1645. ↩ ↩2 ↩3
-
Olsen, A. A., & Rimstidt, J. D. (2008). Oxalate-promoted forsterite dissolution at low pH. Geochimica et cosmochimica acta, 72(7), 1758-1766. ↩
-
House, K. Z., House, C. H., Schrag, D. P., & Aziz, M. J. (2007). Electrochemical acceleration of chemical weathering as an energetically feasible approach to mitigating anthropogenic climate change. Environmental Science & Technology, 41(24), 8464-8470. ↩
-
Krevor, S., & Lackner, K. S. (2008, October). Enhancing the reaction kinetics of the dissolution of serpentine for mineral carbon sequestration. In Second International Conference on Accelerated Carbonation For Environmental and Materials Engineering (ACEME 08) October (pp. 1-3). ↩
-
Wurgaft, E., Wang, Z. A., Churchill, J. H., Dellapenna, T., Song, S., Du, J., et al. (2021). Particle triggered reactions as an important mechanism of alkalinity and inorganic carbon removal in river plumes. Geophysical Research Letters, 48, e2021GL093178. https://doi.org/10.1029/2021GL093178 ↩
-
Ringham, M. C., Hirtle, N., Shaw, C., Lu, X., Herndon, J., Carter, B. R., and Eisaman, M. D. (2024). An assessment of ocean alkalinity enhancement using aqueous hydroxides: kinetics, efficiency, and precipitation thresholds, Biogeosciences, 21, 3551–3570, https://doi.org/10.5194/bg-21-3551-2024 ↩ ↩2
-
Schulz, K. G., Bach, L. T., and Dickson, A. G. (2023). Seawater carbonate chemistry considerations for ocean alkalinity enhancement research: theory, measurements, and calculations. State of the Planet, 2-oae2023, 2, https://doi.org/10.5194/sp-2-oae2023-2-2023. ↩
-
Moras, C. A., Bach, L. T., Cyronak, T., Joannes-Boyau, R., and Schulz, K. G. (2022) Ocean alkalinity enhancement – avoiding runaway CaCO3 precipitation during quick and hydrated lime dissolution, Biogeosciences, 19, 3537–3557, https://doi.org/10.5194/bg-19-3537-2022 ↩ ↩2
-
Iglesias-Rodríguez, M. D., Rickaby, R. E. M., Singh, A., and Gately, J. A. (2023). Laboratory experiments in ocean alkalinity enhancement research, in: Guide to Best Practices in Ocean Alkalinity Enhancement Research, Copernicus Publications, State Planet, 2-oae2023, 5, https://doi.org/10.5194/sp-2-oae2023-5-2023 ↩
-
He and Tyka (2023) Limits and CO2 equilibration of near-coast alkalinity enhancement. Biogeosciences, 20, 27–43. https://doi.org/10.5194/bg-20-27-2023 ↩
-
Suitner, N., Faucher, G., Lim, C., Schneider, J., Moras, C. A., Riebesell, U., and Hartmann, J. (2024). Ocean alkalinity enhancement approaches and the predictability of runaway precipitation processes: results of an experimental study to determine critical alkalinity ranges for safe and sustainable application scenarios, Biogeosciences, 21, 4587–4604, https://doi.org/10.5194/bg-21-4587-2024 ↩
-
Bach, L. T. (2024) The additionality problem of Ocean Alkalinity Enhancement. Biogeosciences, 21, 261–277. https://bg.copernicus.org/articles/21/261/2024/ ↩ ↩2 ↩3
-
Jokiel, P. L. (2011). The reef coral two compartment proton flux model: A new approach relating tissue-level physiological processes to gross corallum morphology. Journal of Experimental Marine Biology and Ecology, 409(1–2), 1–12. https://doi.org/10.1016/j.jembe.2011.10.008 ↩
-
Bach, L. T. (2015). Reconsidering the role of carbonate ion concentration in calcification by marine organisms. Biogeosciences, 12(16), 4939-4951 ↩
-
Monteiro, F. M., Bach, L. T., Brownlee, C., Bown, P., Rickaby, R. E., Poulton, A. J., ... & Ridgwell, A. (2016). Why marine phytoplankton calcify. Science Advances, 2(7), e1501822. ↩
-
Bach, L.T., Gill, S.J., Rickaby R.E.M., et. al. (2019) CO₂ Removal With Enhanced Weathering and Ocean Alkalinity Enhancement: Potential Risks and Co-benefits for Marine Pelagic Ecosystems. Frontiers in Climate. 1:7. doi: 10.3389/fclim.2019.00007 ↩ ↩2 ↩3
-
Langer, G., Geisen, M., Baumann, K. H., Kläs, J., Riebesell, U., Thoms, S., & Young, J. R. (2006). Species‐specific responses of calcifying algae to changing seawater carbonate chemistry. Geochemistry, geophysics, geosystems, 7(9).doi:10.1029/2005GC001227 ↩
-
Renforth, P. (2019) The negative emission potential of alkaline materials. Nature Communications, 10, 1401. https://doi.org/10.1038/s41467-019-09475-5 ↩
-
Hay, B. J. (1988). Sediment accumulation in the central western Black Sea over the past 5100 years. Paleoceanography, 3(4), 491-508. doi:10.1029/PA003i004p00491 ↩
-
Kopelevich, O., Burenkov, V., Sheberstov, S., Vazyulya, S., Kravchishina, M., Pautova, L., ... & Grigoriev, A. (2014). Satellite monitoring of coccolithophore blooms in the Black Sea from ocean color data. Remote sensing of environment, 146, 113-123. doi: 10.1016/j.rse.2013.09.009 ↩
-
Bach, L. T., Mackinder, L. C., Schulz, K. G., Wheeler, G., Schroeder, D. C., Brownlee, C., & Riebesell, U. (2013). Dissecting the impact of CO2 and pH on the mechanisms of photosynthesis and calcification in the coccolithophore Emiliania huxleyi. New Phytologist, 199(1), 121-134. ↩
-
Bach, L. T., Riebesell, U., Gutowska, M. A., Federwisch, L., & Schulz, K. G. (2015). A unifying concept of coccolithophore sensitivity to changing carbonate chemistry embedded in an ecological framework. Progress in Oceanography, 135, 125-138. ↩
-
Gafar, N. A., Eyre, B. D., & Schulz, K. G. (2018). A conceptual model for projecting coccolithophorid growth, calcification and photosynthetic carbon fixation rates in response to global ocean change. Frontiers in Marine Science, 4, 433. ↩
-
Bednaršek, N., Pelletier, G., van de Mortel, H., García-Reyes, M., Feely, R., & Dickson, A. (2024). Unifying framework for assessing sensitivity for marine calcifiers to ocean alkalinity enhancement identifies winners, losers and biological thresholds–importance of caution with precautionary principle. EGUsphere, 2024, 1-37. ↩
-
Gately, J. A., Kim, S. M., Jin, B., Brzezinski, M. A., & Iglesias-Rodriguez, M. D. (2023). Coccolithophores and diatoms resilient to ocean alkalinity enhancement: A glimpse of hope?. Science Advances, 9(24), eadg6066. doi:10.1126/sciadv.adg6066 ↩
-
Zhang, S., Planavsky, N. J., Katchinoff, J., Raymond, P. A., Kanzaki, Y., Reershemius, T., & Reinhard, C. T. (2022). River chemistry constraints on the carbon capture potential of surficial enhanced rock weathering. Limnology and oceanography, 67, S148-S157.https://doi.org/10.1002/lno.12244 ↩
-
Harrington, K. J., Hilton, R. G., & Henderson, G. M. (2023). Implications of the Riverine Response to Enhanced Weathering for CO2 removal in the UK. Applied Geochemistry, 152, 105643.https://doi.org/10.1016/j.apgeochem.2023.105643 ↩ ↩2
-
Kantzas, E. P., Val Martin, M., Lomas, M. R., Eufrasio, R. M., Renforth, P., Lewis, A. L., ... & Beerling, D. J. (2022). Substantial carbon drawdown potential from enhanced rock weathering in the United Kingdom. Nature Geoscience, 15(5), 382-389. https://doi.org/10.1038/s41561-022-00925-2 ↩ ↩2
-
Beerling, D. J., Kantzas, E. P., Lomas, M. R., Wade, P., Eufrasio, R. M., Renforth, P., ... & Banwart, S. A. (2020). Potential for large-scale CO2 removal via enhanced rock weathering with croplands. Nature, 583(7815), 242-248. https://doi.org/10.1038/s41586-020-2448-9 ↩
-
Kanzaki, Y., Planavsky, N. J., & Reinhard, C. T. (2023). New estimates of the storage permanence and ocean co-benefits of enhanced rock weathering. PNAS nexus, 2(4), pgad059. https://doi.org/10.1093/pnasnexus/pgad059 ↩ ↩2 ↩3
-
Mu, L., Palter, J. B., & Wang, H. (2023). Considerations for hypothetical carbon dioxide removal via alkalinity addition in the Amazon River watershed. Biogeosciences, 20(10), 1963-1977. https://doi.org/10.5194/bg-20-1963-2023. ↩
-
Wilkinson, M., Dumontier, M., Aalbersberg, I. et al. (2016). The FAIR Guiding Principles for scientific data management and stewardship. Scientific Data, 3, 160018. https://doi.org/10.1038/sdata.2016.18 ↩
-
Lloyd, C. E. M., Johnes, P. J., Pemberton, J. A., Yates, C. A., Jones, D., & Evershed, R. P. (2022). Sampling, storage and laboratory approaches for dissolved organic matter characterisation in freshwaters: Moving from nutrient fraction to molecular-scale characterisation. Science of the Total Environment, 827, 154105.↩ ↩
-
Golub, M., Desai, A. R., McKinley, G. A.,Remucal, C. K., & Stanley, E. H. (2017).Large uncertainty in estimating pCO2 from carbonate equilibria in lakes. Journal of Geophysical Research: Biogeosciences, 122. https://doi.org/10.1002/2017JG003794 ↩
-
Dickson, A.G., Sabine, C.L. and Christian, J.R. (Eds.) 2007. Guide to Best Practices for Ocean CO2 Measurements. PICES Special Publication, 3, 191 pp. ↩
-
Carter, B. R., Barbero, L., Sharp, J. D., Schockman, K. M., Dickson, A. G., Álvarez, M., Fong, M. B., Fassbender, A. J., & Sutton, A. J. (2024). Random and systematic uncertainty in ship-based seawater carbonate chemistry observations. Limnology and Oceanography. (DOI: 10.1002/lno.12674) ↩
-
Pötter, L., Tollrian, R., Wisotzky, F., & Weiss, L. C. (2021). Determining freshwater pCO₂ based on geochemical calculation and modelling using PHREEQC. MethodsX, 8, 101430. https://doi.org/10.1016/j.mex.2021.101430 ↩
Contributors