Contents
1.0
Introduction
This Protocol provides the requirements and procedures for the calculation of net carbon dioxide equivalent (CO2e) removal from the atmosphere via Electrolytic Seawater Mineralization. Electrolytic Seawater Mineralization is a marine Carbon Dioxide Removal (CDR) technique that uses electrolysis of seawater, i.e. the process of using electricity to split water into hydrogen and oxygen gas, to facilitate the Removal and Storage of carbon as solid minerals and dissolved bicarbonates and carbonate ions1, 2. This CDR process occurs within a closed system and has a co-benefit of on-site hydrogen production (Figure 1).
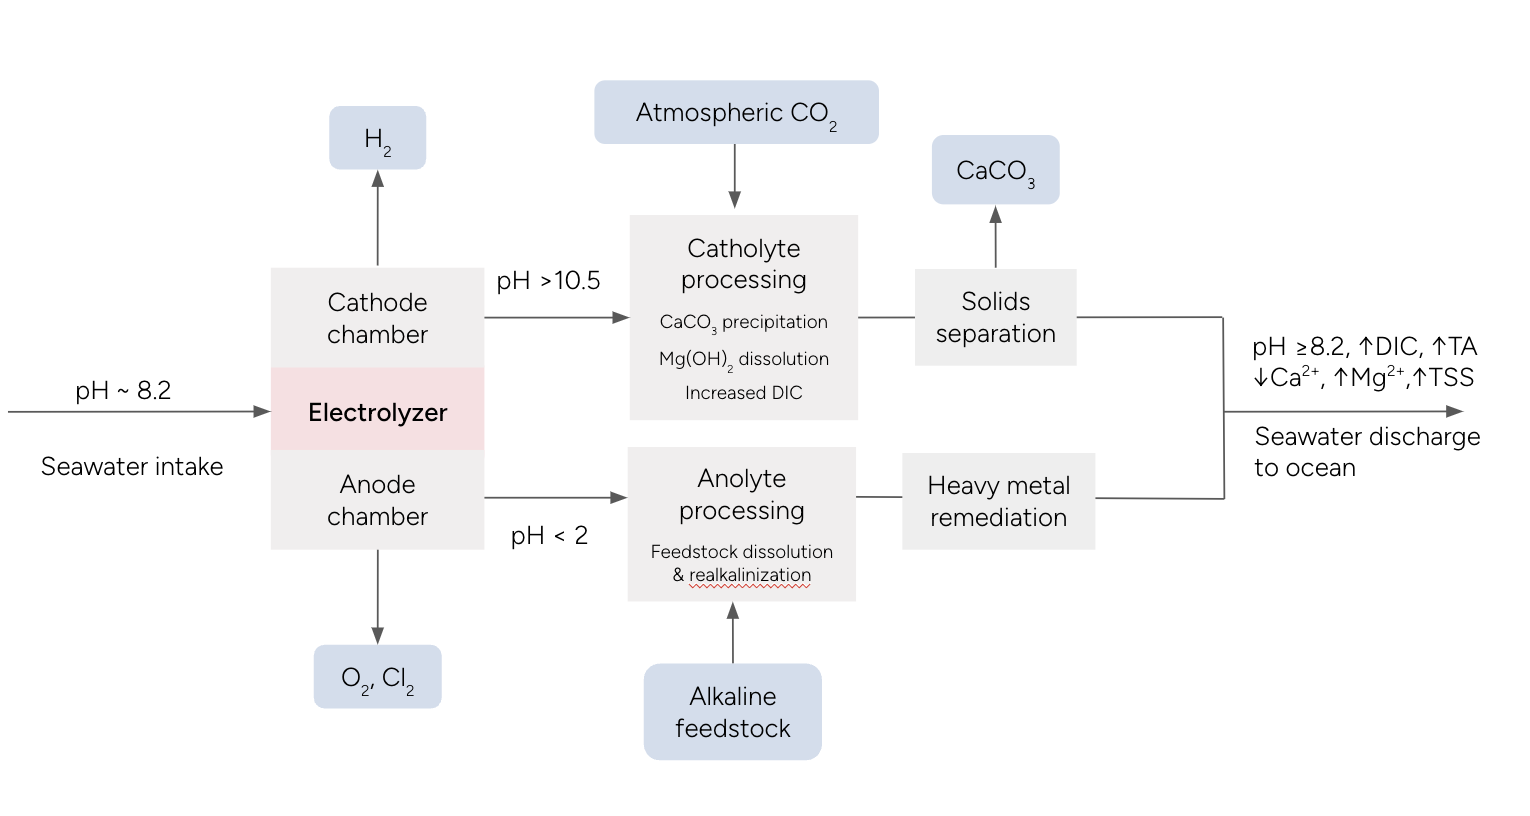
Figure 1 Example process diagram for an Electrolytic Seawater Mineralization facility.
Electrolysis of seawater starts with preprocessing seawater, then passing it through an electrolyzer. The electrolyzer consists of an electrochemical cell, where the negative electrode is called the cathode and the positive electrode is called the anode. When a voltage is applied, the seawater is split to generate aqueous acids and bases, as well as hydrogen, oxygen, and chlorine gas. The fluid surrounding the anode (anolyte) becomes more acidic with pH < 2, while the fluid surrounding the cathode (catholyte) becomes more alkaline with pH > 10. Typically, there will be a semi-permeable barrier such as an ion-selective membrane between the anode and cathode, so that the acidic and alkaline streams remain separated. The catholyte and anolyte are each separately processed, before being recombined and discharged into the ocean.
In the catholyte, pH and saturation indices for calcium carbonate and brucite are significantly increased above typical seawater levels. As a result, calcium ions and magnesium ions are precipitated as calcium carbonate and magnesium hydroxide, leading to a decrease in dissolved inorganic carbon (DIC) in the seawater. As the catholyte is carbonated with atmospheric CO2, calcium carbonate is further precipitated, while magnesium hydroxide is dissolved back into solution, enabling additional uptake of DIC. Catholyte processing restores and increases DIC above influent levels due to the increased capacity for DIC from increased alkalinity and DIC lost from mineral precipitation. The pH of the catholyte decreases after catholyte processing but remains above influent pH levels. In some cases, solid carbonates may be separated out and stored on land. In the acidic anolyte, alkaline feedstocks are added to neutralize the acidity and restore the alkalinity that was removed in the catholyte. Heavy metals which may be released during anolyte processing must be remediated to environmentally safe levels. The anolyte and catholyte are recombined so that near natural seawater pH is achieved prior to discharge into the ocean.
The atmospheric CO2 removal resulting from this process can be quantified by the amount of CO2 stored in solid carbonate minerals plus the change in DIC between the effluent and influent, minus losses of CO2 back to the atmosphere. Approximately 90% of the CO2 removal is removed as DIC and 10% is removed as carbonate minerals. The CO2 removal occurs fully within the facility, and the effluent will have elevated alkalinity, DIC, altered concentrations of Ca and Mg, potentially elevated TSS, and similar pH compared to the ambient seawater. The removed atmospheric CO2 can be stored as DIC in the ocean, solid carbonate minerals in the ocean, and solid carbonate minerals on land.
While Electrolytic Seawater Mineralization has its similarities to other marine CDR (mCDR) approaches such as Ocean Alkalinity Enhancement and Direct Ocean Removal, a key difference is the equilibration of CO2 with seawater, which occurs within the closed system as opposed to the open ocean. This offers two unique advantages, by enabling direct measurement of CO2 uptake and ensuring the transient period of large perturbations to the carbonate system occur within a controlled facility rather than the open ocean.
Note that throughout this Protocol, use of the word "must" indicates a requirement, whereas "should" indicates a recommendation.
2.0
Sources and Reference Standards and Methodologies
Specific standards and protocols which are utilized as the foundation of this protocol and for which this protocol is intended to be fully compliant with are the following:
- Isometric Standard
- ISO (International Organization for Standardization) 14064-2: 2019 – Greenhouse Gases – Part 2: Specification with guidance at the project level for quantification, monitoring and reporting of greenhouse gas emission reductions or removal enhancements
Additional reference standards that inform the requirements and overall practices incorporated in this protocol include:
- ISO 14064-3: 2019 - Greenhouse Gases - Part 3: Specification with Guidance for the verification and validation of greenhouse gas statements
- ISO 14040: 2006 - Environmental Management - Lifecycle Assessment - Principles & Framework
- ISO 14044: 2006 - Environmental Management - Lifecycle Assessment - Requirements & Guidelines
- A Code of Conduct for Marine Carbon Dioxide Removal Research, Aspen Institute, 2021
- Methodology for Measurement, Reporting, and Verification of Electrolytic Oceanic Carbon Dioxide Removal, EcoEngineers, 2024
- BS EN 15978:2011 Sustainability of construction works - Assessment of environmental performance of buildings - Calculation method
3.0
Future Versions
This Protocol was developed based on the current state of the art and current publicly available science regarding Electrolytic Seawater Mineralization, and mCDR generally. As Electrolytic Seawater Mineralization is a novel CDR approach, with limited published literature, the protocol incorporates requirements that may be highly stringent to minimize risk and for the purposes of environmental and social safeguarding.
This Protocol will be altered in future versions as the science underlying Electrolytic Seawater Mineralization evolves, and the overall body of knowledge and data across all processes is increased, for example regarding feedstock supply, conversion, ecosystem impacts and durable storage.
This Protocol will be reviewed at a minimum every 2 years and/or when there is an update to scientific published literature which would affect net CO2e removal quantification or the monitoring and modeling guidelines outlined in this Protocol.
4.0
Applicability
This Protocol applies to Projects and associated operations that meet all of the following project conditions:
- utilizes electrolysis to split seawater into an alkaline catholyte and acidic anolyte, while co-producing hydrogen.
- precipitates carbonate minerals at the cathode and equilibrates catholyte with air to remove atmospheric CO2, producing dissolved inorganic carbon and carbonate minerals.
- neutralizes the anolyte acidity with alkaline feedstock, recombines anolyte and catholyte streams, and restores seawater pH greater or equal to ambient seawater pH prior to discharge.
- provides a net-negative CO2e impact (net CO2e removal) as calculated in compliance with Section 8, on a cradle to grave Greenhouse Gas (GHG) assessment basis.
- is operating within all relevant and applicable regulations and permitted operation levels.
- is considered additional, in accordance with the requirements of Section 5.4.
- provides long duration storage (>1,000 yr) of CO2 in seawater and/or carbonate minerals.
This protocol only quantifies CDR within the project facility (i.e., within a closed system). Additional uptake of CO2 that occurs in the open ocean after discharge is not eligible for crediting.
5.0
Relation to the Isometric Standard
The following topics are covered briefly in this protocol due to their inclusion in the Isometric Standard, which governs all Isometric protocols. See in-text references to the Isometric Standard for further guidance.
5.1
Project Design Document
For each specific project to be evaluated under this protocol, Project Proponents must document project characteristics in a Project Design Document (PDD) as outlined in Section 3.2 of the Isometric Standard. The PDD will form the basis for project verification and evaluation in accordance with this protocol, and must include consideration of processes unique to Electrolytic Seawater Mineralization projects, such as:
- detailed feedstock characterization, if applicable, see Rock and Mineral Feedstock Characterization Module 1.0,
- description of the mitigation plan according to the environmental and social risk assessment in adherence with Section 10.3.5, including an accompanying robust monitoring plan to ensure efficacy,
- description of the quantification strategy for gross CO2e removal following Section 8,
- description of all measurement and methods used to quantify processes relevant to the calculation of net CO2e removal, cross-referenced with relevant standards where applicable,
- documentation of official permitting
5.2
Verification and Validation
Projects must be validated and net CO2e removals verified by an independent third party, consistent with the requirements described in this Protocol as well as in Section 4 of the Isometric Standard.
The Validation and Verification Body (VVB) must consider the following requisite components:
- Validate that the feedstock adheres to the requirements listed in the Rock and Mineral Feedstock Characterization Module 1.0.
- Verify that the quantification approach adheres to requirements of Section 8, including demonstration of required records.
- Verify that the Environmental & Social Safeguards outlined in Section 6 are met.
- Verify that the project is compliant with requirements outlined in the Isometric Standard.
5.2.1
Verification Materiality
The threshold for Materiality, considering the totality of all omissions, errors and mis-statements, is 5%, in accordance with Section 4.3 of the Isometric Standard.
Verifiers should also verify the documentation of Uncertainty of the GHG statement as required by Section 2.5.7 of the Isometric Standard. Qualitative materiality issues may also be identified and documented, such as:
- control issues that erode the verifier’s confidence in the reported data;
- poorly managed documented information;
- difficulty in locating requested information;
- noncompliance with regulations indirectly related to GHG emissions, removals or storage
5.2.2
Site Visits
Project Validation and Verification must incorporate site visits to project facilities in accordance with the requirements of ISO 14064-3, 6.1.4.2, including, at a minimum, site visits during validation and initial verification. Validators should, whenever possible, observe project operations to ensure full documentation of process inputs and outputs through visual observation (see Section 4 of the Isometric Standard).
A site visit must occur at least once every 2 years at each location.
5.2.3
Verifier Qualifications & Requirements
Verifiers and validators must comply with the requirements defined in Section 4 of the Isometric Standard. In addition, VVB teams shall maintain and demonstrate expertise associated with the specific technologies of interest.
All VVBs are approved by Isometric independently and impartially based on alignment with Conflict of Interest policies, rotation of VVB policies, oversight on quality and the following requirements:
- VVBs must be able to demonstrate accreditation from:
- an International Accreditation Forum member against ISO 14065 or other relevant ISO standard, including but not limited to ISO 14034, ISO 17020, ISO 17029; or
- a relevant governmental or intergovernmental regulatory body.
- Alternatively, on a case-by-case basis, if VVBs are able to demonstrate to Isometric that they satisfy all required Verification needs and competencies required for the relevant Protocol and follow the guidelines of ISO 19011 or other relevant standards, they may be approved.
Refer to Sections 4.4, 4.5, and 4.6 for more information on verifier qualifications and requirements.
5.3
Ownership
CDR via Electrolytic Seawater Mineralization can often be a result of a multi-step process (such as quarrying, alkaline feedstock processing, transporting and on-site operations, hydrogen production), with activities in each step managed and operated by a different operator, company or owner. When there are multiple parties involved in the process, and to avoid double counting of net CO₂e removal, a single Project Proponent must be specified contractually as the sole owner of Credits. Contracts must comply with all requirements defined in Section 3.1 of the Isometric Standard.
5.4
Additionality
The Project Proponent must be able to demonstrate additionality through compliance with Section 2.5.3 of the Isometric Standard. The counterfactual scenarios and baselines utilized to assess additionality must be project-specific, and are described in Section 8 of this Protocol.
Additionality determinations must be reviewed and completed every two years, at a minimum, or whenever project operating conditions change significantly, such as the following:
- regulatory requirements or other legal obligations for project implementation change or new requirements are implemented
- project financials indicate carbon finance is no longer required, potentially due to, for example
- increased tipping fees for waste feedstocks
- sale of co-products (such green hydrogen) that make the business viable without carbon finance
- reduced rates for capital access
Any review and change in the determination of additionality shall not affect the availability of carbon finance and Credits for the current or past Crediting Periods, but, if the review indicates the project has become non-additional, this shall make the project ineligible for future Credits.
5.5
Uncertainty
The uncertainty in the overall estimate of net CO2e removal as a result of the project must be accounted for. The total net CO2e removal for a specific Reporting Period must be conservatively determined, and projects must conduct an uncertainty analysis for the net CO₂e removal calculation in compliance with requirements outlined in Section 2.5.7 of the Isometric Standard.
5.5.1
Reporting of Uncertainty
Projects must report a list of all key variables used in the net CO2e removal calculation and their uncertainties, as well as a description of the uncertainty analysis approach, including:
- required measurements used for net CO2e removal calculation
- emission factors utilized, as published in public and other databases used
- values of measured parameters from process instrumentation, such as truck or pallet weights from weigh scales, electricity usage from utility power meters and other similar equipment
- laboratory analyses, including analysis of seawater chemistry and alkaline feedstocks
The uncertainty information should at least include the minimum and maximum values of each variable that goes into the net CO2e removal calculation (see Section 8 for more details). More detailed uncertainty information should be provided if available, as outlined in Section 2.5.7 of the Isometric Standard.
In addition, a sensitivity analysis that demonstrates the impact of each input parameter’s uncertainty on the final CO2e removal uncertainty must be provided. Details of the sensitivity analysis method must be provided such that a third party can reproduce the results. Input variables may be omitted from an uncertainty analysis if they contribute to a < 1% change in the net CO2e removal. For all other parameters, information about uncertainty must be specified.
5.6
Data Reporting and Availability
In accordance with the Isometric Standard, all evidence and data related to the underlying quantification of net CO2e removal and environmental monitoring will be available to the public through Isometric’s Science Platform. That includes:
- Project Design Document
- GHG Statement
- Measurements taken
- Model specifications and output
- Emission factors used
- Scientific literature used
The Project Proponent can request certain information to be restricted (only available to authorized buyers, the Registry and VVB) where it is subject to confidentiality. However, that does not apply to any numerical data produced or used as part of the quantification of net CO2e removal.
6.0
Environmental and Socio-economic Safeguarding
6.1
Overarching Principles
Following the Isometric Standard, Credits issued under this Protocol are contingent on the implementation, transparent reporting and independent verification of comprehensive safeguards. These safeguards encompass a wide range of considerations, including environmental protection, social equity, community engagement and respect for cultural values. The process mandates that safeguard plans be incorporated into all major project phases, with detailed reports made accessible to stakeholders. Adherence to and verification of environmental and socio-economic safeguards is a condition for all Crediting Projects.
6.2
Governance and Legal Framework
Due to the novelty of marine CDR projects, in many cases, the international, regional and local legal frameworks have yet to catch up with this new industry3, although the EPA has released guidance and frameworks on mCDR permitting structures in the US 4. There are also existing regulations on ocean discharges at the international, national, regional and local level that may apply for Electrolytic Seawater Mineralization activities. Additionally, specific permits may be required for the installation of an ocean intake, outfall or effluent pipe.
The minimum requirements for coastal projects are:
- Project Proponents must identify jurisdictional authorities, including local rightsholders, of the water body of the project site and affected areas.
- Project Proponents must receive official permitting for the project from all relevant authorities of the water body of the project site and affected areas.
- Project Proponents must observe ratified provisions in international conventions where relevant, and enter into good faith negotiations with Isometric to resolve potential conflicts between applicable regulations and standards. Some examples of potential relevant international conventions are:
- the Convention on the Prevention of Marine Pollution by Dumping of Wastes and Other Matter (“London Convention”) and the Protocol to that Convention (“London Protocol”)
- the United Nation Convention on the Law of the Sea
- the International Convention for the Prevention of Pollution from Ships
- the Basel Convention
- the European Union Marine Strategy Framework Directive.
6.3
Risk Mitigation Strategies
Environmental and social risk assessment in adherence with Section 3.7 of the Isometric Standard must be completed to identify potential risks, followed by the development of tailored mitigation plans. These plans must encompass specific actions to avoid, minimize or rectify identified impacts. Effective implementation of these measures must also be accompanied by a robust monitoring plan to detect negative impacts and stop projects when necessary (see Section 11).
For additional guidance and resources on identifying and assessing risk of CDR projects in coastal and marine contexts, we refer Project Proponents to
- Research Strategy for Ocean-based Carbon Dioxide Removal and Sequestration
- Guide to Best Practices in Ocean Alkalinity Enhancement Research
6.3.1
Environmental Safeguards
The Project Proponent must conduct an environmental risk assessment which adheres to Section 3.7.1 of the Isometric Standard. Specific risks to be considered for Electrolytic Seawater Mineralization are listed below. The list will be updated in future iterations of the Protocol as new research emerges.
Potential additional environmental risks associated with Electrolytic Seawater Mineralization are listed below. The severity of these risks vary based on site specificities, and the intensity and duration of marine CDR activities. Environmental and social risk identification, assessment, avoidance, and mitigation planning will be unique to each Project’s technological, environmental, and social contexts. This list is a minimum to which Isometric and the supplier can add risks on a case by case basis, which would be included in the PDD:
Feedstock sourcing:
- Potential risks associated with feedstocks include land use impacts from sourcing, production, preparation, storage, and distribution, such as land degradation, land occupation, dust pollution, deforestation and localized watershed contamination.
Co-products and waste:
- Generation of co-products and waste must be accompanied by a plan which ensures safe handling, containment and disposal.
Marine pollution prevention :
- Metal contamination (as nutrients or toxic elements) from dissolution of feedstock(s) and potential for resulting bioaccumulation of metals in the food chain 7,8
- If silica is a product of feedstock dissolution, changes in silicate concentrations could alter diatom growth rates and shift diatom community composition9
- Increased particulates and suspended solids loading due to the mCDR activity could have unknown consequences on ambient light, consumption by filter feeders and flocculation. For example, increased turbidity can generate turbid plumes, which may affect water quality while suspended and affect benthic habitats upon settling
- Removal of inorganic nutrients due to secondary precipitation could drive nutrient limitation, resulting in a decrease in biological productivity or shift in ecosystem composition 9
Marine biodiversity:
- Changes in carbonate chemistry, such as pH, could directly help or harm aquatic life depending on the magnitude and direction of the pH shift, and can have a disproportionate impact on calcification, which could lead to positive or negative ecological regime shifts 10, 9, 11, 12
- Cascading impacts of altered carbonate chemistry, nutrient fields, or particle deposition on biodiversity, organismal and microbial assemblages, and ecosystem functions (including non-native species, pathogens, migration routes and patterns, food webs, productivity) in upper-ocean, mid-ocean, and benthic regions both at Project sites and in their vicinity
- For projects with seawater intake pipes, marine biota may be adversely impacted by impingement, entrainment and entrapment from pumping, pre-treatment and the CDR process 13, 14
- Shock to the ecosystem due to rapid or sudden changes in carbonate system parameters
When assessing marine environmental risks, it is important to holistically consider the context, for instance keeping in mind the project impacts in relation to the risk of climate change. Projects are not expected to demonstrate zero changes to the ocean ecosystem due to:
- Difficulty in defining the appropriate baseline. The current measured “baseline” in the ocean is rapidly evolving due to climate change. For instance, changes to the ocean state due to climate change increasingly threaten aquatic life through warming temperatures, acidification, increased prevalence of marine disease, mass mortalities and ecological regime shifts 15.
- Challenges in attributing causation. Observed changes to the marine environment may arise as a result of a CDR project, or from another reason such as a marine heat wave, pollution from a nearby source, etc.
- Risk-benefit analysis of scaling CDR. Scaling CDR technologies, including ocean-based approaches, is critical to meet Paris Agreement targets. Marine CDR technologies are designed to alter the ocean state, so some changes should be expected, particularly at scale.
However, it is important to try to minimize as much as possible any large and/ adverse impacts.
6.3.2
Socio-economic Safeguards
The Project Proponent must conduct a social risk assessment which adheres to Section 3.7.2 of the Isometric Standard on Social Impacts. Marine CDR projects must conduct an environmental justice review, which considers the historical inequities in the distribution of coastal amenities and disamenities prior to site selection.
6.4
Stakeholder Engagement
Per Section 3.5 of the Isometric Standard, Project Proponents must demonstrate active stakeholder engagement throughout project planning and operation, ensuring that all risk mitigation strategies contribute to sustainable project outcomes. Local stakeholders situated in the vicinity of the project site may contribute an in-depth understanding of the local system and provide invaluable insights and recommendations on the potential risks, necessary safeguards and specific monitoring needs. Relevant local stakeholders may include local members of academia, Indigenous groups, environmental groups, citizen associations and other users of the marine space, such as commercial and recreational fishermen, shellfish farmers, boaters and recreational users. The Stakeholder input process must adhere to requirements outlined in Section 3.5 of the Isometric Standard, and evidence of these meetings must be submitted in the PDD.
6.5
Adaptive Management
Project Proponents must include in the PDD a plan for information sharing, emergency response and conditions for stopping or pausing a deployment. Plans for pausing or stopping a deployment must be in place in instances where:
- instrument malfunctions lead to data-gaps in required monitoring
- effluent exceeds thresholds outlined in the PDD
- regulatory non-compliance, e.g. danger to ecosystem health detected (such as by the local community or government agency)
- compromised health and/or safety of workers and/or local stakeholders
7.0
System Boundaries
7.1
Reporting Period
The Reporting Period represents an interval of time over which removals are calculated and reported for verification. The total net CO₂e removal is calculated using a series of measurements for a specified Reporting Period, and is written hereafter as .
GHG emission calculations must include all emissions related to the project activities that occur within the Reporting Period. This includes: a) any emissions associated with project establishment allocated to the Reporting Period, b) any emissions that occur within the Reporting Period, c) any anticipated emissions that would occur after the Reporting Period that have been allocated to the Reporting Period and d) leakage emissions that occur outside of the system boundary as a result of induced market changes that are associated with the Reporting Period. See Section 8.5 and Section 8.6 for more details on calculating these emissions.
7.2
System Boundary & GHG Emissions Scope
The scope of this protocol includes GHG sources, sinks and reservoirs (SSRs) associated with an Electrolytic Seawater Mineralization project which meet the applicability criteria described in Section 4. A cradle-to-grave GHG Statement must be prepared encompassing the GHG emissions relating to the activities outlined within the system boundary. The system boundary must include all SSRs controlled by and related to the project, including but not limited to the SSRs in Figure 2 and Table 1.

Figure 2 System boundaries for an Electrolytic Seawater Mineralization project which meets Applicability criteria described in Section 4.
The system boundary must include all GHG SSRs from activities related to the batch of Credits delivered within the Reporting Period associated with the establishment of the project, operations and end-of-life activities that occur after the Reporting Period. This corresponds to the terms of Equation 7 in Section 8.5, which describes the emissions associated with a Reporting Period.
Any emissions from sub-processes or process changes that would not have taken place without the involvement of the CDR process, such as subsequent transportation, must be fully considered in the system boundary. This allows for accurate consideration of additional, incremental emissions induced by the CDR process.
If any GHG SSRs within Table 1 are deemed not appropriate to include in the system boundary, they may be excluded provided that robust justification and appropriate evidence is provided.
Table 1. Scope of activities and GHG SSRs to be included by the removal project
| Activity | GHG source, sink or reservoir | GHG | Scope | Timescale |
|---|---|---|---|---|
| Project Establishment | Equipment and materials manufacture | All GHGs | Embodied emissions associated with equipment and materials manufacture for project establishment (lifecycle modules A1-316). To include product manufacture emissions for equipment, buildings, infrastructure and temporary structures. | Before electrolysis starts - must be accounted for in the first Reporting Period or amortized in line with allocation rules (See Section 8.5.1) |
| Equipment and materials transport to site | All GHGs | Transport emissions associated with transporting materials and equipment to the project site(s) (lifecycle module A416). | ||
| Construction and installation | All GHGs | Emissions related to construction and installation of the project site(s) (lifecycle module A516). To include energy use for construction, installation and groundworks, as well as waste processing activities and emissions associated with land use change. | ||
| Initial surveys and feasibility studies | All GHGs | Any embodied, energy and transport emissions associated with surveys or feasibility studies required for establishment of the project site. | ||
| Misc. | All GHGs | Any SSRs not captured by categories above. | ||
| Operations | Feedstock manufacturing | All GHGs | Feedstock raw material extraction and manufacturing including rock quarrying, crushing, grinding and drying. | Over each Reporting Period - must be accounted for in the relevant Reporting Period (See Section 8.5.2) |
| Feedstock transport | All GHGs | Feedstock transport from source manufacturer to project site. | ||
Electrolytic seawater mineralization plant | All GHGs | Emissions associated with Electrolytic Seawater Mineralization Plant, including electrolysis, catholyte processing and analyte processing. This includes the following:
| ||
| Carbonated mineral transport | All GHGs | Carbonate mineral transport from Electrolytic Seawater Mineralization Plant to storage site. For example electrolytes and electrodes used for electrolysis, absorbents for gases. | ||
| Storage site | All GHGs | Emissions associated with carbonate mineral storage at the storage site including:
| ||
| CO₂ Stored | CO₂ only | The gross amount of CO₂ removed and durably stored from a project over a Reporting Period. | ||
| Sampling required for MRV | All GHGs | Monitoring, including consumables used for measurement and transportation or shipping of samples for laboratory analysis and sample processing. | ||
| Staff travel | All GHGs | Flight, car, train or other travel required for the project operations, including contractors and suppliers required on site. | ||
| Surveys | All GHGs | Embodied, energy and transport emissions associated with undertaking required surveys e.g., environmental surveys. | ||
| Misc. | All GHGs | Any SSRs not captured by categories above. For example, accidental or unintended release of pre-equilibrated catholyte may result in secondary precipitation and ocean outgassing, or unneutralized anolyte streams may result in ocean outgassing. If these events occur, their impacts must be quantified. | ||
| End-of-Life | End-of-life of project facilities | All GHGs | Anticipated end-of-life emissions (lifecycle modules C1-416). To include deconstruction and disposal of the project site(s), equipment, vehicles, buildings or infrastructure. | After Reporting Period - must be accounted for in the first Reporting Period or amortized in line with allocation rules (See Section 8.5.3) |
| Ongoing surveys | All GHGs | Embodied, energy and transport emissions associated with undertaking long-term required surveys e.g., ecological surveys. | ||
| Ongoing sampling and monitoring required for MRV | All GHGs | Embodied, energy and transport emissions related to ongoing monitoring of carbonate mineral storage site, measurement equipment, and energy use associated with monitoring equipment, sampling systems, laboratory analysis, operation and management of monitoring facility buildings and handling equipment. | ||
| Misc. | All GHGs | Any emissions source, sink or reservoir not captured by categories above. |
The Project Proponent must consider all GHGs associated with SSRs, in alignment with the United States Environmental Protection Agency’s definition of GHGs, which includes: carbon dioxide (CO₂), methane (CH4), nitrous oxide (N2O) and fluorinated gasses such as hydrofluorocarbons (HFCs), perfluorocarbons (PFCs), sulfur hexafluoride (SF6) and nitrogen trifluoride (NF3). For CO₂ capture and CO₂ leakage, only CO₂ is expected to be included as part of the quantification. For all other activities all GHGs must be considered. For example, CO₂, CH4 and N2O are all associated with diesel consumption.
All GHGs must be quantified and converted to CO₂e. GHGs must be converted to CO₂e in the GHG Statement using the 100-yr GWP for the GHG of interest, based on the most recent volume of the IPCC Assessment Report (currently the Sixth Assessment Report)17.
Projects conducting electrolysis resulting in hydrogen gas must also account for any hydrogen leakage that results during production and storage. While hydrogen is not a heat trapping gas like those listed above, its release into the environment effectively prolongs the lifetime of methane through a series of atmospheric chemical reactions18. An analysis in one recent study concluded that the equivalent 100-yr GWP of H2 is 11.6 ± 2.8 (one standard deviation)19. Given this relatively high uncertainty, Project Proponents must use 14.4 (one standard deviation above the mean) when accounting for H2 in a Reporting Period.
Miscellaneous GHG emissions are those that cannot be categorized by the GHG SSR categories provided in Table 1. The Project Proponent is responsible for identifying all sources of emissions directly or indirectly related to project activities and must report any outside of the SSR categories identified as miscellaneous emissions.
Emissions associated with a project's impact on activities that fall outside of the system boundary of a project must also be considered. This is covered under Leakage in Section 8.5.4.
7.3
System Boundary Considerations
7.3.1
Ancillary Activities
Ancillary activities, such as supplementary research and development activities and corporate administrative activities, that are associated with a project but are not directly or indirectly related to the issuance of Credits can be excluded from the system boundary.
7.3.2
Secondary Impacts on GHG Emissions
Electrolytic Seawater Mineralization may have additional impacts on GHG emissions beyond the scope of this Protocol, which are detailed in Section 8.2. Considerations for release of undissolved alkalinity, incomplete acid neutralization and biological fertilization are required.
7.3.3
Waste Input Emissions
Embodied emissions associated with system inputs considered as waste products can be excluded from the accounting of the GHG Statement system boundary of the CDR process if all of the below criteria are met:
- The waste product is fundamentally tied to, or the result of, a separate process.
- The separate process was already happening and likely to continue operating in absence of the CDR process.
- The amount of the waste product used by the CDR project was not already being utilized as a valuable by-product or co-product by another party for non-CDR uses.
- Market leakage emissions are fully considered.
An example to illustrate this would be mine tailings generated by an operational, profitable mine. If the tailings would likely be generated without the CDR project in a baseline scenario and the rest of the criteria above are met, they can be used in the GHG accounting without an emissions burden.
The Project Proponent must provide documentation that the above criteria are met in order to omit such emissions from the GHG Statement.
In the case that a relevant separate process would not continue operating or would not begin operating without revenue from waste product valorization, emissions should be allocated to the waste product used in the CDR process using standard allocation methods as outlined by ISO 14044. In the case that a waste product from a separate process was already being used as a by-product to serve some other process, emissions generated from the displacement of the supply of the by-product must be considered as part of the Leakage assessment (See Section 8.5.4).
In some instances, it may be appropriate to consider impacts to counterfactual weathering of waste alkaline feedstocks. For example, if the feedstock used constitutes a waste product that was not mined or quarried specifically for project activities and was stored in open-air conditions, some degree of surficial weathering may be expected over timescales relevant to a project lifetime. Project Proponents using these feedstocks must account for the counterfactual weathering of the feedstock in the baseline assessment (See Section 7.4).
7.3.4
Project Activities Integrated into Separate Practices
The project may be reliant on processes occurring separately from the CDR activity, for example, co-locating and making use of desalination plants, cooling water from power plants or other industrial ocean intake pipes or outfalls. Activities that were already occurring and would continue to occur without the Electrolytic Seawater Mineralization project may be omitted from the system boundary, provided that evidence that the activity was already occurring and would have continued to occur in the absence of the Electrolytic Seawater Mineralization project can be provided.
Any impacts on the separate process that would require changes to the existing separate facility, such as additional infrastructure requirements associated with heavier loads for incorporating Electrolytic Seawater Mineralization processes, shall be considered within the system boundary.
The separate facility must not consider the Electrolytic Seawater Mineralization process within their GHG accounting to avoid double counting of removals.
7.3.5
Co-product Emissions Allocation
The process of Electrolytic Seawater Mineralization produces hydrogen as a co-product. To allocate project emissions associated with CDR and the co-product, the Project Proponent may use one or a combination, where relevant, of the following co-product allocation procedures outlined below.
Procedure 1: Allocate all emissions to CDR
Projects may opt to allocate all project emissions to CDR. The hydrogen co-product must still comply with all relevant emission accounting regulations and requirement, which may mean emissions are double counted. As such, this is the most conservative approach to take.
Procedure 2: Divide the process into sub-processes
Where possible, the process may be divided into sub-processes. For example it may be possible to isolate processes relating to processing and storing hydrogen only. Only sub-processes and relevant inputs that are physically separable may undergo division, for example electricity usage for equipment with separate electricity meters. Sub-processes that are physically separable and do not contribute to CDR may be excluded from the system boundary.
Procedure 3: Substituting emissions
Project Proponents may substitute the co-product emissions with emissions for an equivalent product and subtract these from total project GHG emissions. This is often referred to as "expanding the system boundary" in Life Cycle Assessment literature20. Section 8.6.4 details the calculation approach to follow for substituting emissions.
7.4
Baseline
The baseline scenario for an Electrolytic Seawater Mineralization project assumes the activities associated with the project do not take place and any associated infrastructure is not built. Qualifying projects under this Protocol are not expected to significantly alter the natural ocean uptake of CO₂, and projects are required to assess potential ocean losses of CO₂ in the removal quantification (see Section 8.1.3).
For most projects meeting applicability conditions in Section 4, the counterfactual is expected to be 0 (See Section 8.4). However, there may be instances in which the counterfactual weathering of waste alkaline feedstocks should be considered, which is described in Section 7.3.3.
8.0
Net CDR Calculation
Net CO₂e removal from Electrolytic Seawater Mineralization removal for each reporting period, RP, must be calculated conservatively so as to give high confidence that, at minimum, the estimated net CO₂e was removed.
The net CO₂e removal equation is:
Equation 1
Where
-
represents the total net CO₂e removal for reporting period, RP, in tonnes of CO2e
-
represents the total CO₂ removed as solid carbonates or Dissolved Inorganic Carbon (DIC) in seawater due to the Project activity for reporting period, RP, in tonnes CO2e.
-
represents the total counterfactual CO2 removed from the atmosphere for the reporting period, RP, in tonnes of CO2e. This term is expected to be 0 in most cases. See Section 8.4.
-
represents the total GHG emissions associated with the project including leakage, over a reporting period, RP, in tonnes of CO₂e.
8.1
Calculation of CO₂eStored, RP
Type: Capture/Sequestration
The total CO2 that is removed and durably stored is determined using direct measurements at multiple locations throughout the Electrolytic Seawater Mineralization process (Figure 3), and subtracting any potential losses upon discharge into the ocean. Electrolysis splits seawater into a catholyte and anolyte stream which are alkaline and acidic respectively. The catholyte and anolyte streams are processed independently before being recombined and discharged to the ocean.
Catholyte
The catholyte stream has elevated total alkalinity (TA) and pH, resulting in the precipitation of calcium carbonate and brucite. Carbon removal occurs during catholyte processing where the catholyte is equilibrated with ambient air. The catholyte processing results in brucite dissolution, further calcium carbonate precipitation, increased DIC, and restoration of pH levels similar to or above the seawater intake. Carbonate minerals which are precipitated out of solution can be separated from the catholyte stream. Measurements of the system seawater intake (A) and outflow (E), as well as the precipitated separated solids, are used to quantify carbon removal. Additional measurements throughout the catholyte stream before and after catholyte processing are used for independent validation and reconciliation checks on the carbon removal calculation (see Section 8.3.2.3).
Anolyte
The anolyte stream is acidic, and is neutralized to pH levels similar to or above the seawater intake via the addition and dissolution of alkaline feedstock in the anolyte processing chamber. The decreased pH of the anolyte stream may lead to outgassing of CO2 in the anolyte chamber, which is a loss of CO2 removal. Ingassing may also occur during anolyte processing, with the restoration of pH which reduces pCO2. The extent of ingassing will depend on the duration and extent of air-liquid interaction. While it is recommended that these potential CO2 fluxes be measured and recorded as a sense check on the carbon mass flow, the carbon accounting in this protocol relies on direct measurements of DIC after recombination (E), which will include any outgassing and ingassing fluxes that occur during anolyte processing. The alkaline feedstock is required to be characterized prior to being used as an input (see Section 10.0), and additional measurements of the anolyte stream before and after anolyte processing are used to confirm acid neutralization (see Section 11.1).
Ocean discharge
The system effluent, comprising the recombined catholyte and anolyte streams, has a similar pH to the intake stream and elevated levels of total alkalinity and DIC, altered concentrations of Ca and Mg ions, and potentially elevated levels of TSS. Upon discharge into the ocean, there may be additional losses of CO2 that must be considered and subtracted from the removal quantification if determined to be relevant. These losses are described in Section 8.1.3.
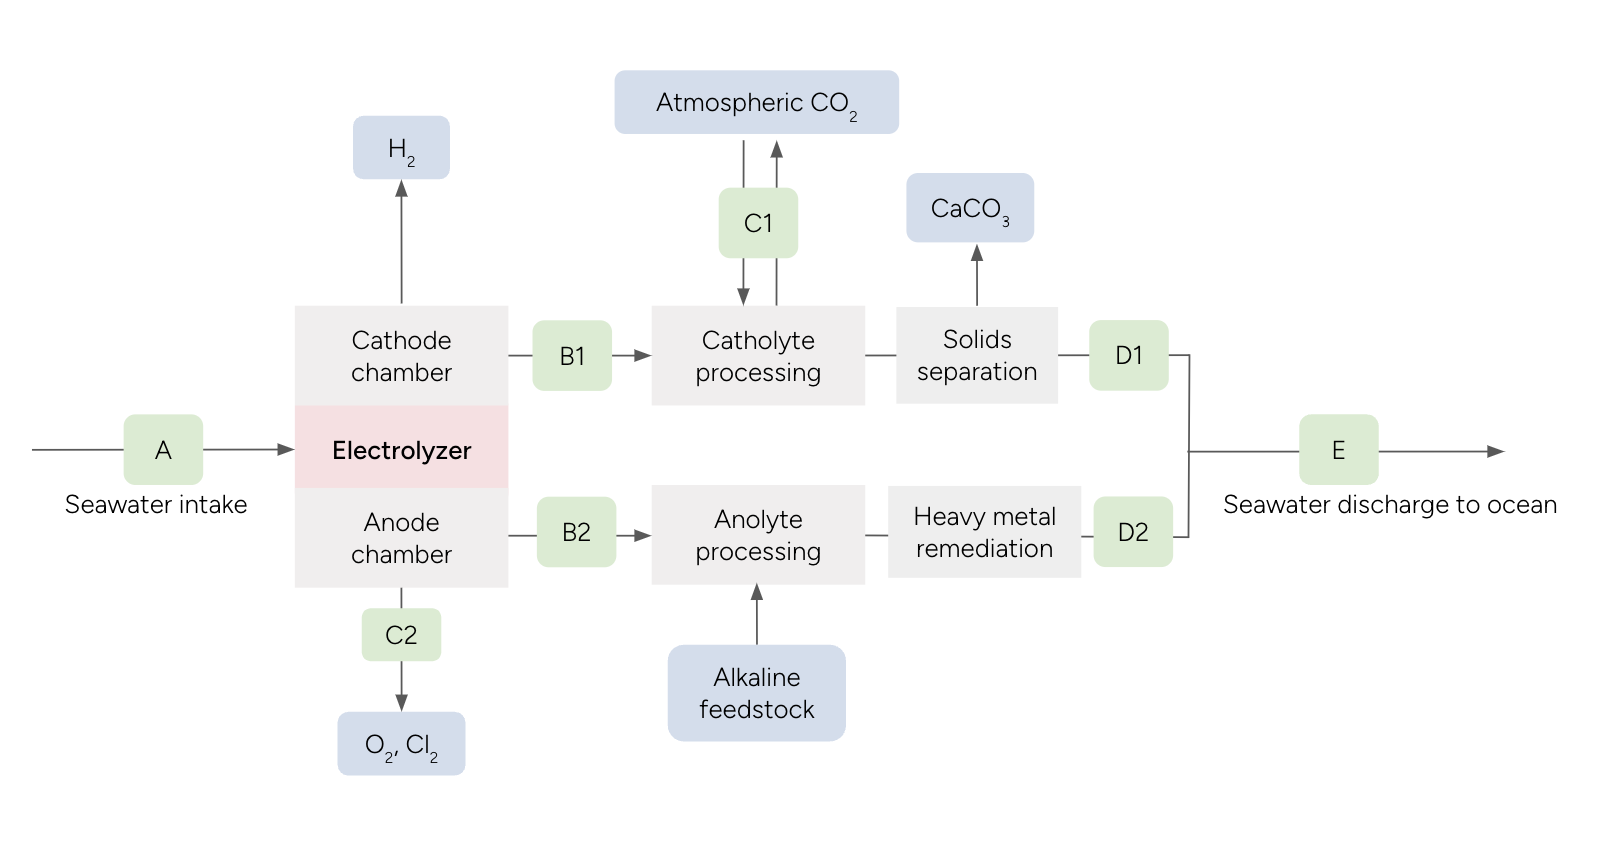
Figure 3 Process diagram for Electrolytic Seawater Mineralization Removal facility with measurement locations shown in green.
The total amount of carbon stored can be determined as follows:
Equation 2
Where
- represents the change in CO2e stored in marine dissolved inorganic carbon between the seawater inflow and the processed water discharge.
- represents the total CO2e stored in carbonate minerals over reporting period RP.
- represents the sum of losses which occur upon effluent discharge to the ocean and reduces the total CO2e stored by the Project activity for reporting period, RP, in tonnes CO2e.
8.1.1
Calculation of ΔCO₂eDIC, RP
represents the cumulative change in CO2e stored in marine dissolved organic carbon over a reporting period, RP. This term can be calculated as the change in DIC between the seawater inflow and the processed water discharge, summed over the reporting period. This term can be calculated as follows:
Equation 3
Where
-
represents the change in marine DIC between the seawater inflow and the processed water discharge, in tonnes of CO2e.
-
is the time period over which measurements are averaged, in minutes.
-
is the total number of time intervals in the reporting period to be summed over.
-
represents the average concentration of DIC at measurement point over time interval , in moles of C per kilogram of seawater
-
represents the average flow rate of water at measurement point over time interval , in liters per minute.
-
represents the average density of seawater at measurement point over time interval , in kilograms per liter (may be derived from observed temperature and salinity).
-
represent the ratio of CO2e removed from the atmosphere per unit of DIC added.
-
represents the molecular weight of , 4.401x10⁻⁵ tonnes per mole.
measurements, including those for and must target combined , and . Methodologies and/or SOPs including calibration and standardization details must be included in the PDD. Analytical methods for bottle samples of carbonate system parameters are highly recommended to follow the Guide to Best Practices for Ocean CO2 Measurement14. Note that if carbonate feedstocks are used in anolyte processing, then Project Proponents must quantify the DIC added as a result of carbonate feedstock dissolution and subtract that from .
8.1.2
Calculation of CO₂eCarbonate, RP
represents the total amount of new CO2e stored in carbonate minerals as a result of Electrolytic Seawater Mineralization removal. These carbonate minerals are precipitated in the cathode chamber and during catholyte processing.
Project Proponents must take one of two approaches to quantify the carbonate content and corresponding CO2e of the precipitated minerals. These options are summarized below and detailed in the subsequent sections:
- Option 1: direct weighing of mineral precipitate combined with carbonate content and phase distribution analysis, or
- Option 2: measurement of the change in primary carbonate-forming cations before and after catholyte processing
Project Proponents are recommended to use both approaches. Project Proponents must designate one of the above options as the primary approach and use another approach for reconciliation (See Section 8). The reconciliation calculation can be the other option listed, or Project Proponents can propose an alternate approach which must be agreed upon in consultation with Isometric.
8.1.2.1
Option 1: Mass-based Measurements
New carbonate mineral formation may be determined from direct measurements of the mass and carbon content of separated solids and the difference in concentration and carbon content of suspended solids between the effluent and influent.
Equation 4
Where
-
represents the total CO2e stored in carbonate minerals over reporting period RP, in tonnes of CO2e.
-
represents the total mass of separated material removed from the cathode processing stream, in tonnes.
-
represents the amount of CO2e stored per mass of separated carbonate minerals, in % wt. Acceptable methods for measuring this term include calcimetry or thermogravimetric analysis of representative samples.
-
represents the conversion factor between tonnes to kilograms.
-
is the time period over which measurements are averaged, in minutes.
-
is the total number of time intervals in the reporting period to be summed over.
-
represents the concentration of total suspended solids (TSS) at measurement point over time interval , in kilograms per liter.
-
represents the average flow rate of water at measurement point over time interval , in liters per minute
-
represents the amount of CO2e stored per mass of suspended solids, in % wt, at measurement point over time interval . Acceptable methods for measuring this term include calcimetry or thermogravimetric analysis of representative grab samples.
Sample collection of wet solids to determine must occur at the same time as measurement of . Direct measurement of mass may come from truck scales of trucks used to transport carbonate minerals from the site of precipitation to the storage location. Mass of carbonate solids must be evidenced by documentation of truck weights containing the separated carbonate minerals.
Wet solids samples must be appropriately stored between sample collection and laboratory analysis, either by measuring water content and drying the sample or keeping the sample sealed in fridge or freezer. Water content of the wet solids must be determined and deducted from if is reported based on a dry mass basis.
at point A may be zero due to pre-filtering of influent seawater. In that case, the term may be dropped from Equation 4. Furthermore, if carbonate feedstocks are used in anolyte processing and enter the effluent stream at point E in solid form, then Project Proponents must quantify the carbonate minerals added as a result of anolyte processing and subtract that from .
8.1.2.2
Option 2: Liquid-phase Measurements
New carbonate formation may be determined from the net change in the concentration of carbonate-forming ions between the influent (point A) and post-catholyte processing stream (point D1). Calcium ions (Ca) and magnesium ions (Mg) will be the primary cation constituents of any resulting carbonate-bearing minerals considering the average seawater composition and saturation state of carbonate-bearing minerals under the conditions encountered throughout cathode processing. Therefore, direct measurement and in are the only cations used for quantifying .
Equation 5
Where
-
represents the total CO2e stored in carbonate minerals over reporting period RP, in tonnes of CO2e.
-
is the time period over which measurements are averaged, in minutes.
-
is the total number of time intervals in the reporting period to be summed over.
-
represents the average concentration at measurement point X over time interval , in moles C per kilogram of seawater.
-
represents the average density of processed seawater at measurement point X over time interval , in kilogram per liter
-
represents the average flow rate of water at measurement point X over time interval , in liters per minute
-
represents the molar ratio of removed for every cation removed from seawater.
-
represents the molecular weight of , 4.401x10⁻⁵, tonnes CO2e per mole.
-
represents the average concentration at measurement point X over time interval , in moles C per kilogram of seawater.
-
represents the molar ratio of removed for every cation removed from seawater.
Note that the above equation assumes an identical frequency of sampling for and . An alternative formulation of the equation may be necessary if sampling frequencies are not the same.
Analytical techniques for the determination of and must be ion specific (i.e., techniques must produce concentrations for and separately as opposed to bulk hardness). Measurements may be taken using discrete (e.g., ICP-MS, ICP-OES) or continuous (e.g., ion-selective electrode) techniques. For continuous sampling, all sensors must be calibrated and maintained according to the manufacturers specifications, with records kept onsite and accessible to the VVB. For discrete sampling, the PDD must describe how the chosen sampling cadence captures any likely variability resulting from environmental factors (e.g., temperature, seasonal flow paterns, river discharge, precipitaiton, etc.) or system state parameters (e.g., flow rate).
and must be determined analytically from representative samples of carbonate minerals collected from the cathode processing stream. Samples of carbonate minerals must be collected and analyzed a minimum of monthly and may include X-ray diffraction (mineralogical identity), mass spectrometry (for determination of Ca and Mg abundance in solids), and calcimetry and/or thermogravimetric analysis (carbonate content). The methods, SOPs, and determination of derived terms must be described in the PDD. Sampling frequency may be reduced to quarterly once project areas can demonstrate less than 1 percent coefficient of variation of and in monthly average versus quarterly average.
8.1.3
Calculation of CO₂eOceanLosses, RP
Upon discharge of pre-equilibrated, TA-enriched, and DIC-enriched effluent in the ocean, the following processes can cause losses that may reduce the efficiency of Electrolytic Seawater Mineralization:
- CO2 outgassing upon initial mixing with ocean seawater
- CO2 outgassing from secondary precipitation
- CO2 outgassing from biotic calcification
- changes in natural DIC and TA fluxes or buffering of natural TA release from interactions of carbonate minerals and TA-enriched, DIC-enriched effluent with sediments
The sum of these processes are considered . Understanding these and potential other loss terms is an active area of scientific research, and the list of known losses in this Protocol and quantification approach will be updated as research evolves. In the PDD, Project Proponents must describe the risk of these losses, as well as a strategy for quantifying them or a justification of why the losses are negligible. Due to the difficulty and uncertainty in quantifying the impact of these processes at this time, acceptable treatment of loss terms in this Protocol include:
- avoiding the likelihood of these losses by identifying avoidance strategies around conditions which lead to non-negligible loss terms, with corresponding monitoring to demonstrate adherence to those guardrails
- estimating a conservative upper limit of alkalinity loss based on scientific literature, first principles calculations, and/or experimentation
- process-based modeling studies
- direct measurements
- alternative approaches that are sufficiently justified
Data, measurements and evidence used in the quantification of losses must be publicly disclosed. Example recommendations for each loss term are discussed below. Much of the existing research in these loss terms have been motivated by Ocean Alkalinity Enhancement (OAE), and do not simulate the carbonate chemistry state of the effluent from the Electrolytic Seawater Mineralization process described in this protocol. Project Proponents are recommended to conduct research on these loss terms in the relevant carbonate chemistry parameter space for their specific process.
Initial Mixing
Nonlinear mixing of the Electrolytic Seawater Mineralization effluent and receiving ocean waters may result in ingassing or outgassing depending on the pCO2 of the resultant mixture relative to ambient seawater pCO2.
Net ingassing relative to the ocean baseline is more likely than outgassing. This is because if the effluent stream is at or below atmospheric pCO2, nonlinear mixing of the effluent and ambient seawater results in a pCO2 deficit with respect to ambient seawater. This may result in a net additional uptake or reduced natural outgassing in the ocean through air-sea gas equilibration. CO2 uptake in the open ocean is not considered for crediting under this Protocol, however this effect acts as a buffer against initial mixing losses.
Outgassing upon initial mixing could occur due to oversaturation of CO2 in the effluent or significant temperature differences between the effluent and receiving ocean waters.
The recommended quantification approach is to estimate the difference between the measured DIC at point E and the theoretical equilibrium DIC of the discharge and ambient seawater mixture calculated at ambient ocean conditions (temperature, salinity, pH, and pCO2), using either CO2SYS or PHREEQC.
Secondary Precipitation
Secondary precipitation of calcium carbonate in seawater could cause CO₂ outgassing. In the open ocean, abiotic calcium carbonate precipitation is rare because spontaneous nucleation is strongly inhibited in seawater21, 22, 23, and most carbonate production is thought to be biologically mediated24. There are very few areas of the ocean where spontaneous carbonate precipitation is observed (e.g. the Great Bahama Bank and the Persian Gulf24). Such locations typically have exceptionally high saturation states (i.e. > 19)25. In coastal areas, higher suspended particulates may increase nucleation. Early research suggests there is a relationship between increased alkalinity loss due to precipitation with higher TSS in the receiving water body26. In the effluent pipe, pipe roughness can also increase potential nucleation sites. Thus, the risk of secondary precipitation is most pronounced in the effluent pipe, mixing zone and coastal domain, where the carbonate chemistry perturbation and potential nucleation sites are largest.
Limiting pH and the aragonite saturation state has been shown to be effective at avoiding this result, and laboratory research to characterize the critical thresholds that trigger precipitation under close-to-natural conditions are ongoing27, 28, 29, 30. Furthermore, precipitation dynamics occur on a timescale between minutes to hours27, 29, which suggests that dilution could be an effective risk mitigation strategy31.
An example avoidance strategy is setting a pH threshold, with consideration of carbonate chemistry variables, TSS and dilution at the site, and continuous monitoring of carbonate chemistry variables and TSS to ensure that conditions for secondary precipitation are avoided. In some cases, secondary precipitation can be identified by an observed increase in turbidity. Monitoring of turbidity is recommended, however it may be difficult to isolate a signal from secondary precipitation over natural fluctuations.
Biotic Calcification
Increases in biotic calcification can cause CO₂ outgassing. The carbonate chemistry conditions promoted by Electrolytic Seawater Mineralization could promote calcification due to the lowered H+/ elevated saturation state32, 33, 34, 35. Alkaline feedstock dissolution may release trace metals which has the potential to fertilize blooms of calcifiers9.
Early stage research manipulating Total Alkalinity with the aim of simulating OAE has found no significant increase in biologically produced calcium carbonate at elevated alkalinity in the ocean36, 12. However, the Black Sea, a naturally elevated alkalinity environment, harbors extensive blooms of the coccolithophores 37, 38, a major group of calcifying plankton. This is thought to be due to the favorable carbonate chemistry promoted by the elevated alkalinity regime35.
This is still an area where more research is needed, particularly through mesocosm and field trials, albeit there is a rich body of literature on lab and mesocosm scale species-specific responses to changing seawater carbonate chemistry 39. The risk of alkalinity loss due to biotic calcification may be project and location specific. Recently published meta-analyses synthesizing data from ocean acidification studies for OAE support this claim that species and functional group specificity is likely 40. Coastal areas with significant benthic calcification of CaCO3 sediments may be especially susceptible to this feedback.
A recommended avoidance strategy is setting thresholds on pH and TA (e.g., pH < 9, TA < 1000 μmol/kg in effluent pipe prior to discharge, which are lower perturbations than in previous studies showing no significant increase in biologically produced CaCO3, or as determined for the specific deployment site)36, and monitoring for changes in ocean biota.
Interactions with Sediments
Early research suggests that OAE may reduce natural alkalinity fluxes from sediments41. This risk may be exacerbated by projects with settling particles which result in alkalinity enrichment in sediments, and the potential impacts on the net removal calculation is highly uncertain at this time. More research in this area is needed and the Protocol will be updated with future advancements.
A recommended avoidance strategy for Electrolytic Seawater Mineralization projects is to limit accumulation of alkalinity on the sea bed through careful design of discharge rates and infrastructure. Potential monitoring approaches may include sediment sampling, measuring particle settling and accumulation rates. Alternatively, acceptable evidence for quantification could include numerical modeling of particle transport in receiving waters, sediment sampling, sediment transport modeling, measuring benthic alkalinity fluxes, measuring changes in net calcification at the sea bed and sediment diagenesis modeling.
8.2
Broader Impacts on CDR
Discharge of Undissolved Alkalinity
Brucite is formed at the cathode and redissolved during catholyte processing. Alkaline solids may also be released to the effluent stream during anolyte processing. Any undissolved alkalinity which is released in the effluent as TSS will dissolve in the open ocean and enhance local alkalinity. This will result in increased pH, total alkalinity (TA), and potentially facilitate additional CO2 uptake via air-sea gas exchange if the alkaline enriched waters remain in contact in the atmosphere.
Projects must quantify undissolved alkalinity through characterization of solids to ensure complete dissolution of alkalinity in the closed system, such as with thermogravimetric analysis of grab samples of effluent TSS at point E42. Additional solids separation prior to discharge may be required to prevent release of undissolved alkalinity to the open ocean. Projects which aim to discharge undissolved alkalinity into the ocean and quantify open ocean CDR must refer to Isometric's Ocean Alkalinity Enhancement from Coastal Outfalls Protocol.
Biological Fertilization
The release of elements (such as iron, silica, nitrogen and phosphorus) and DIC-enriched waters could lead to increases in primary production or changes in phytoplankton community structure, which may have a broader impact on biological carbon export. The potential impacts on CO2 removal are not accounted for in this Protocol, and Project Proponents must select alkaline feedstocks which minimize the risk of fertilization, and monitor for changes in biological responses to CDR.
Incomplete Acid Neutralization
The acidic anolyte stream must be neutralized prior to release. This Protocol requires the recombination of catholyte and anolyte streams, and recovery of pH to ambient local seawater pH prior to discharge.
If the anolyte stream is released to the ocean prior to neutralization, the acid in the anolyte would lead to outgassing of CO2 in the ocean and counteract the CDR occurring within the closed system. Spillages of unneutralized anolyte and/or unneutralized acid by-products (such as potential acidic slurry) must be reported, quantified and treated as a loss against CDR.
An alkalinity/acidity budget is recommended on the anolyte stream to demonstrate the acid neutralization capacity of the alkaline feedstock is consistent with observed changes in pH in the anolyte, and TA loss through precipitation in the catholyte is replenished.
8.3
Validation and Reconciliation Calculations
8.3.1
Validation Measurements
Within the Electrolytic Seawater Mineralization system, there are several points throughout the process where direct measurement of the carbonate system and associated parameters may be observed (see Section 11.1 for full list of monitoring locations). Measurements along these locations are recommended as checks that the facility and process are operating as expected. For example, these measurements can be used to:
- validate the carbonate system and associated parameters along each step of the Electrolytic Seawater Mineralization process
- conduct a Ca and Mg ion budget throughout the system
- conduct a DIC budget throughout the system
- conduct an alkalinity/acidity budget throughout the system
- validate the mineral phase distribution and CO2 content in collected solids grab samples
Project Proponents should describe any additional validation measurements they are collecting throughout the facility in the PDD, particulary if they increase confidence in the efficacy of the system.
8.3.2
Reconciliation Calculations
Reconciliation calculations are independent checks on the amount of carbon removed as DIC or carbonate minerals for each Reporting Period. Project Proponents are required to complete reconciliation calculations for the key carbon removal terms in Equation 2: and . Discrepancies beyond the analytical precision of the methods used must be reported to the VVB and Isometric, addressed with a system audit, and explained. After the audit, the more accurate value must be used and justified. Recommended reconciliation calculations are described below, alternative approaches must be agreed upon with Isometric.
8.3.2.1
Dissolved Inorganic Carbon Concentrations
DIC concentration is directly measured at several points throughout the Electrolytic Seawater Mineralization process. DIC can also be calculated using carbonate system solvers such as CO2SYS and PHREEQC. Given any two of pH, TA and pCO2, DIC can be solved through the equations of chemical thermodynamics. Using pH and TA will give a more accurate estimate of DIC than using pH and pCO2, however more frequent measurements can be made with pCO2 due to the existence of autonomous pCO2 instruments. Project Proponents should corroborate the DIC directly measured for the calculation of in Equation 3 with calculated DIC values.
8.3.2.2
CO₂ Contained in Carbonate Minerals
There are two options available for quantifying , which are described in Section 8.1.2. Both Option 1 (solid phase measurements) and Option 2 (liquid phase measurements) are expected to result in the same estimate for , assuming full dissolution of brucite and negligible carbonate mineral precipitation and dissolution upon recombination. Undissolved brucite detected by solids characterization must be subtracted from the total amount of solids. Project Proponents should check that the results of both options for calculating agree.
8.3.2.3
CO₂ Uptake at Catholyte Processing
The sum of CO2 uptake at point C2 represents the flux of atmospheric carbon into seawater as DIC or carbonate minerals during catholyte processing. This term can be calculated as:
Equation 6
Where
-
represents the maximum uptake of atmospheric CO2 into seawater as DIC or carbonate minerals, in tonnes CO2e.
-
is the time period over which measurements are averaged, in minutes.
-
is the total number of time intervals in the reporting period to be summed over.
-
represents the average mass flow rate of air at catholyte processing, in kg/min. This term can be measured in L/min and converted to kg/min using the density of air.
-
represents the concentration of CO2 in the air stream as it enters the catholyte processing chamber over time interval , in %wt of CO2.
-
represents the concentration of CO2 in the air stream as it exits the catholyte processing chamber over time interval , in %wt of CO2.
Note that this term does not include CO2 fluxes that occur during anolyte processing. If there is no net ingassing or outgassing during anolyte processing, then can serve as a check on the sum of + calculated according to Section Section 8.1. However, if + > , there is net ingassing at the anolyte, whereas if + < indicates net outgassing at the anolyte. It is recommended that an audit of the CO2 on the anolyte is conducted to close any discrepancies in the carbon mass balance.
8.4
Calculation of CO₂eCounterfactual, RP
Type: Counterfactual
For Electrolytic Seawater Mineralization, the counterfactual is typically considered to be 0 if all applicability criteria are met and conditions outlined in Section 4 are also met. The applicability criteria, combined with required quantification of potential ocean losses (Section 8.1.3), are necessary to ensure additionality above any changes in natural ocean uptake induced by the project43.
For projects using waste alkaline feedstocks, there may be instances in which the counterfactual weathering of the feedstocks should be considered (see Section 7.3.3 for an example). In these cases, Project Proponents must determine appropriate treatment of the counterfactual in consultation with Isometric.
8.5
Calculation of CO₂eEmissions, RP
Type: Emissions
is the total GHG emissions associated with a Reporting Period, . This can be calculated as:
Equation 7
Where
- represents the total GHG emissions for a Reporting Period, in tonnes of CO₂e.
- represents the GHG emissions associated with project establishment, represented for the Reporting Period, in tonnes of CO₂e, see Section 8.5.1.
- represents the total GHG emissions associated with operational processes for a Reporting Period, in tonnes of CO₂e, see Section 8.5.2.
- represents GHG emissions that occur after the Reporting Period and are allocated to a Reporting Period, in tonnes of CO₂e, see Section 8.5.3.
- represents GHG emissions associated with the project’s impact on activities that fall outside of the system boundary of a project, over a given Reporting Period, in tonnes of CO₂e, see Section 8.5.4.
The following sections set out specific quantification requirements for each variable.
8.5.1
Calculation of CO₂eEstablishment, RP
GHG emissions associated with project establishment should include all historic emissions incurred as a result of project establishment, including but not limited to the SSRs set out in Table 1.
Project establishment emissions occur from the point of project inception up until the first Reporting Period. Establishment emissions may be accounted for in the following ways, with the allocation method selected and justified by the Project Proponent:
- as a one time deduction from the first removal
- allocated to removals as annual emissions over the anticipated project lifetime
- allocated per output of product (i.e., per tonne CO₂ removed) based on estimated total production over project lifetime
The anticipated lifetime of the project should be based on reasonable justification and should be included in the Project Design Document (PDD) to be assessed as part of project validation.
Allocation of project establishment emissions to removals must be reviewed at each Crediting Period renewal and any adjustments made. If the Project Proponent is not able to comply with the allocation schedule described in the PDD e.g., due to changes in delivered volume or anticipated project lifetime, the Project Proponent should notify Isometric as early as possible in order to adjust the allocation schedule for future removals. If that is not possible, the [Reversal] process will be triggered in accordance with the Isometric Standard, to account for any remaining emissions.
8.5.2
Calculation of CO₂eOperation, RP
GHG emissions associated with should include all emissions associated with operational activities, including but not limited to the SSRs set out in Table 1.
emissions must be attributed to the Reporting Period in which they occur. Allocation may be permitted in certain instances, on a case by case basis in agreement with Isometric.
8.5.3
Calculation of CO₂eEnd-of-Life, RP
includes all emissions associated with activities that are anticipated to occur after the Reporting Period, but are directly or indirectly related to the Reporting Period. For example, this could include ongoing sampling activities for Monitoring, Reporting, and Verification (MRV) for the specific deployment (directly related), or end-of-life emissions for the project facility (indirectly related to all deployments).
GHG emissions associated with may occur from the end of the Reporting Period onwards, and typically through to completion of project site deconstruction and any other end-of-life activities.
GHG emissions associated with activities that are directly related to each deployment must be quantified as part of that Reporting Period. GHG emissions associated with activities that are indirectly related to all deployments may be allocated in the same ways as set out in .
Given the uncertain nature of emissions, assumptions must be revisited at each Crediting Period and any necessary adjustments made. Furthermore, if there are unexpected emissions associated with a Reporting Period, or the project as a whole, that occur after the project has ended, then the Reversal process will be triggered to compensate for any emissions not accounted for.
8.5.4
Calculation of CO₂eLeakage, RP
includes emissions associated with a project's impact on activities that fall outside of the system boundary of a project. It includes increases in GHG emissions as a result of the project displacing emissions or causing a knock on effect that increases emissions elsewhere. As an example, creating a market for feedstocks may generate new revenue in the source sector that alters producer behavior in ways that result in additional GHG emissions.
It is the Project Proponent's responsibility to identify potential sources of leakage emissions, however, for an Electrochemical Marine CO2 Removal project the following must be considered as a minimum:
- feedstock replacement
- consumables replacement
emissions must be attributed to the Reporting Period in which they occur. Allocation may be permitted in certain instances, on a case by case basis in agreement with Isometric.
8.6
Emissions Accounting
8.6.1
Energy Use Accounting
This section sets out specific requirements relating to quantification of energy use as part of the GHG assessment. Emissions associated with energy usage result from the consumption of electricity or fuel.
Examples of electricity usage may include, but are not limited to:
- operation of process equipment (i.e., pumps, mixers, blowers, flow control, measurement instruments)
- operation of electrolyzers, catholyte and anolyte processing
Examples of fuel consumption may include, but are not limited to:
- handling equipment, such as fork trucks or loaders
- fuel consumption of sampling vessels
The Energy Use Accounting Module 1.1 provides guidance on how energy-related emissions must be calculated in a CDR project so that they can be subtracted in the net CO₂e removal calculation. It sets out the calculation approach to be followed for intensive facilities and non-intensive facilities and acceptable emissions factors.
In alignment with the Energy Use Accounting Module 1.1, the consequential impact of electricity usage on the system it is procured from must be included in calculations for intensive projects, as determined in the Energy Use Accounting Module.
Refer to Energy Use Accounting Module for the calculation guidelines.
8.6.2
Transportation Emissions Accounting
This section sets out specific requirements relating to quantification of transportation emissions as part of the GHG Statement.
Emissions associated with transportation include transportation of products and equipment as part of a Reporting Period’s activities. Examples may include, but are not limited to:
- transportation of equipment,feedstock and consumables to the facility
- transportation of separated solid carbonate minerals to storage site
- transportation and shipping related to collection and analysis of samples for environmental monitoring
The Transportation Emissions Accounting Module 1.0 provides guidance on how transportation-related emissions must be calculated in a CDR project so that they can be subtracted in the net CO₂e removal calculation. It sets out the calculation approach to be followed and acceptable emissions factors.
Refer to Transportation Emissions Accounting Module for the calculation guidelines.
8.6.3
Embodied Emissions Accounting
This section sets out specific requirements relating to quantification of embodied emissions as part of the GHG Statement. Embodied emissions are those related to energy use or other emissions during the manufacture of equipment and materials used in a process.
Examples of project-specific materials and equipment that must be considered as part of the embodied emission calculation include but are not limited to:
- feedstock, consumables and associated equipment produced, constructed and utilized explicitly for the CDR project
- electrolyzer, catholyte and anolyte processing equipment
- process equipment (i.e., pumps, mixers, blowers, flow control, measurement instruments)
- environmental monitoring equipment and consumable materials such as batteries, sensors, buoys, instruments and cleaning supplies
- raw materials and equipment used in the fabrication, assembly and construction of plant
- equipment related to waste handling and disposal
The Embodied Emissions Accounting Module 1.0 sets out the calculation approach to be followed including allocation of embodied emissions, life cycle stages to be considered, data sources and emission factors.
Refer to Embodied Emissions Accounting Module for the calculation guidelines.
8.6.4
Substituting Emissions for Co-product Emissions Allocation
One method of co-product emissions allocation is substitution, as outlined in Section 7.3.5. Project Proponents may substitute the co-product emissions with emissions for an equivalent product and subtract these from total project GHG emissions. This is also known as 'expanding the system boundary'.20
The following calculation process must be followed for Project Proponents undertaking the substituting emissions method:
- Report the quantity and type for all marketed co-products produced within the Project system boundary. For co-products that the Project Proponent intends to sell with specific emissions attributes, such as 'green' or 'emissions-free', these intended claims should be specified.
- For each type of co-product generated, the Project Proponent should provide an estimate of the emissions intensity of an identical or highly similar product produced by a facility without CDR production. This emissions intensity factor must be conservative, from a reputable source and approved by Isometric. An example of a suitable emissions intensity factor is regulation specifying a threshold emissions intensity of products sold with specific marketing claims.
- The quantity of merchantable co-products sold should be multiplied by the approved emissions intensity factor to determine the total substituted emissions. The total substituted emissions for a RP may be subtracted from .
9.0
Storage
This Protocol provides multiple options for durable storage of CO₂. The Project Proponent can choose from the following available options, including using a combination of the below options, when submitting their Project for verification.
9.1
Marine Dissolved Inorganic Carbon (DIC) Storage
The primary storage reservoirs of the CO2 removed through Electrolytic Seawater Mineralization is Dissolved Inorganic Carbon (DIC) in the ocean. The Durability and reversal risks of this storage reservoir are discussed in the Ocean DIC Storage Module 1.0.
Ocean DIC Storage Module
9.2
Marine Carbonate Mineral Storage
Some of the stored carbon from Electrolytic Seawater Mineralization may be discharged to the ocean as solid carbonate minerals that will disperse as suspended solids and ultimately settle in sediments. Two core considerations relevant to the durability of marine carbonate minerals are:
- The saturation state of the carbonate mineral phases in the dispersal area, and
- The fate of the carbonate mineral if these phases experience under-saturation and dissolution.
The carbonate mineral phases that will likely be abundant in discharged suspended solids will include calcium carbonate CaCO3 (i.e., calcite and aragonite), and hydrous magnesium carbonate (e.g., nesquehonite MgCO3 3H2O, lansfordite MgCO3 5H2O, hydromagnesite Mg5(CO3)4(OH)2 4H2O, dypingite Mg5(CO3)4(OH)2 5H2O, and others)1,44.
The surface ocean tends to be super-saturated with respect to both primary calcium carbonate phases (calcite and aragonite), indicating a likelihood of mineral stability. The saturation depth, which is the depth at which the saturation index , varies spatially in the world's oceans 45. Above the saturation depth, , which indicates that seawater is supersaturated with respect to calcite or aragonite. Below the saturation depth, indicates that seawater is undersaturated with respect to calcite and aragonite and that dissolution is favored. For calcite, super-saturated conditions tend to be present throughout the water column in the Atlantic Ocean, to greater than 3 kilometers depth in the Indian and Southern Oceans, greater than 2 kilometers depth in the Southern Pacific Ocean, and the topmost several hundred meters in the Northern Pacific Ocean. For aragonite, saturation depths are shallower. Super-saturated conditions are present throughout the water column in the North Atlantic, to greater than 1 km depth in the South Atlantic Ocean and South Indian Ocean, and in the topmost several hundred meters elsewhere45.
In contrast to calcite and aragonite, hydrous magnesium carbonate minerals are generally not observed in the water column or marine sediment, and can therefore be assumed to be under-saturated everywhere in the global ocean. Therefore, calcium carbonate phases are likely to persist as minerals in shallow near shore environments where , whereas magnesium carbonate phases are likely to dissolve upon discharge. Carbonates buried in sediment will be subject to elevated and lower pH due to remineralization of organic matter. After sufficient sedimentation and isolation from the sediment-water interface, conditions will tend towards mineral dissolution46.
Carbonate minerals will dissolve according to the following formula:
Equation 8
where
- represents either Ca or Mg.
Equation 8 shows that for every unit Ca or Mg carbonate that dissolves, two units of alkalinity and one unit of dissolved inorganic carbon (DIC) will be added. Under average ocean pH conditions, divalent alkalinity such as and will stabilize approximate 1.7 molecules of as dissolved inorganic carbon36. Therefore, dissolution of carbonate phases will tend to stabilize 70% more than if the mineral had not dissolved (with values being lower in more isolated, low pH sedimentary environments). Any resulting marine DIC will have an average lifetime in the ocean of 10,000+ years (see Section 9.1 above).
Taken together, carbonate minerals released into the marine environment may be stabilized under super-saturated conditions, or dissolve under under-saturated conditions. Mineral dissolution will lead to increased carbon dioxide removal and storage as marine DIC. In either case, carbonate accounting based on the amount of carbon stored in discharged carbonate solids likely provides a conservative estimate of the total carbon removed, with a minimum durability of 10,000 years after dissolution.
9.3
Carbonated Material Storage and Monitoring
Carbonate-bearing minerals produced during Electrolytic Seawater Mineralization may be separated and stored on land. The requirements for open and closed system carbonated materials storage are provided in the Carbonated Material Storage and Monitoring Module 1.0.
Carbonated Material Storage and Monitoring
9.4
Buffer Pools
As outlined in Section 2.5.9 of the Isometric Standard, the Buffer Pool is a mechanism used to insure against Reversal risks that may be observable and attributable to a particular project through monitoring.
Based on present understanding, reversals in the global ocean Dissolved Inorganic Carbon (DIC) reservoir will not be directly observable with measurements and attributable to a particular project. Reversals of DIC in the ocean is a system-wide storage uncertainty that should be addressed through further scientific research. Carbon stored as DIC in the ocean is classified as having a Very Low Risk Level of Reversal according to the Isometric Standard Risk Assessment Questionnaire. The Buffer Pool corresponding to this lowest risk score is 2% and is intended as an additional precaution against unknowns. Carbonate minerals that are released into the marine environment may end up as DIC if they dissolve, and thus will have the same Reversal Risk and Buffer Pool as DIC in the ocean.
Projects utilizing the Carbonated Material Storage and Monitoring Module 1.0 must also assess the Reversal Risk of the specific storage site following the Isometric Standard Risk Assessment Questionnaire and determine an appropriate Buffer Pool for carbonate mineral storage.
If a project uses more than one storage Module, then the buffer pools should be allocated based on the amount of carbon stored in each resevoir using the formula below:
Equation 9
Where:
- is the total Buffer Pool allocation for the Reporting Period, RP, in tonnes of CO2e
- is the number of storage sites used
- is the Buffer Pool allocation for storage site i, in %
- is the proportion of CO2 stored in storage site i, in %
- represents the total net CO2e removal for Reporting Period, RP, in tonnes of CO2e
Example Calculation of Buffer Pool
An Electrolytic Seawater Mineralization Project removes 1,000 tonnes of CO2e, where 90% of the removed carbon is stored as DIC in the ocean, and 10% is stored as carbonated materials on land. Following a site specific risk assessment of the terrestrial carbonated materials storage site, the Risk Assessment Questionnaire gives a 5% Buffer Pool for terrestrial carbonated materials storage.
Then, the total Buffer Pool for the Reporting Period is:
tonnes CO2e
For more details on Reversals, refer to Sections 2.5.9 and 5.6 of the Isometric Standard.
10.0
Pre-deployment Requirements
All pre-deployment requirements must be described in the PDD, as outlined in Section 5.1. The requirements are as follows:
- Project Proponents must provide a site description of the discharge location including the dominant circulation and modes of variability, as well as the frequency of various environmental conditions. At minimum, information must be provided on seasonal patterns, predominant currents, periods of maximum stratification, and periods when receiving water quality conditions may be more critical.
- Project Proponents must develop a conceptual model of the discharge plume transport and dispersion, such as through producing a mixing zone model (which is usually a standard requirement in ocean discharge permits). The mixing zone model will estimate initial dispersal of the discharge, and will dictate the recommended reach of the monitoring efforts. Sensitivity analysis is required to demonstrate adherence to water quality limits at the boundary of the mixing zone under varying environmental conditions.
- Project Proponents must establish baseline characterization, including carbonate chemistry parameters and trace metal concentrations of trace metals that will or may be released into seawater.
- Project Proponents must have sufficient plans for restoring water quality conditions prior to discharge.
- Rocks and minerals utilized in the anolyte stream must be sufficiently well characterized following Isometric’s Rock and Mineral Feedstock Characterization Module 1.0.
Refer to Rock and Mineral Feedstock Characterization Module for characterization guidelines.
11.0
Monitoring
A monitoring plan must be established prior to project activities and described in the PDD. The aims of the monitoring plan are to:
- quantify net carbon removal, including redundant measurements for reconciliation calculations,
- validate processes occuring throughout the facility,
- demonstrate permit compliance,
- monitor environmental conditions, and
- establish processes for adaptive management to ensure that projects stop if negative impacts are identified.
The monitoring plan must include details about monitoring duration, frequencies, location, SOPs, sample collection methods, analytical methods, thresholds (if applicable), data reporting and quality assurance/quality control. Analysis and reporting of monitoring data and measurement uncertainties should occur for every Reporting Period (see Section 7.1 for definition of a Reporting Period). Monitoring guidance and requirements will be updated in alignment with advances in sensor technology which enhance the capacity for measurement and monitoring.
11.1
Monitoring Locations
For an Electrolytic Seawater Mineralization project, monitoring is required both within the facility as well as in the ocean. This protocol requires and recommends monitoring to occur at the following locations, which are illustrated in Figure 4:
- Seawater intake (A): the intake pipe where seawater is drawn in. Measurements taken here must be after any preprocessing (e.g. filtering) of the seawater and before seawater enters the electrolyzer.
- Catholyte after electrolysis (B1): the catholyte stream immediately after electrolysis, before any atmospheric CO₂ equilibration has occurred.
- Atmospheric injection inlet and outlet (C1): the inlet and outlet of atmospheric gas that is used as the source of CO₂ during catholyte processing.
- Post Catholyte Processing (D1): the catholyte stream after atmospheric equilibration and solids separation has occurred.
- Anolyte after electrolysis (B2): the anolyte stream immediately after electrolysis.
- Atmospheric outgassing at anode (C2) : the outlet of the anode or anolyte holding chamber that is used to monitor CO₂ outgassing.
- Post anolyte processing and heavy metals remediation (D2): the anolyte stream after anolyte processing and heavy metals remediation has occurred.
- Pre-outflow (E): the chamber containing the mixture of fully processed catholyte and anolyte before discharge.
- Separated solids: the solid carbonate minerals that are precipitated in the catholyte, separated from the processed seawater, and transported off site.
- Edge of mixing zone: the mixing zone is the area near the discharge where initial dilution takes place and is a regulatory concept that describes the area where water quality criteria can be exceeded. Beyond the mixing zone, it may be difficult to detect measurable signals from the projects, so in-ocean measurements are concentrated at the edge of the mixing zone. See Section 11.3.1.
- Deployment area: certain measurements, such as for monitoring ecological impacts, may occur outside the mixing zone. Monitoring that occurs outside the mixing zone but still in the vicinity of the project is referred to as within the “deployment area”.
- Control site (not shown in Figure 4): An area which is similar to the project site in all regards except the CDR activity. The use of a control site is determined on a site by site basis as outlined in the PDD and is not universally required.
Monitoring locations must be included in the monitoring plan submitted in the PDD.

Figure 4 Monitoring locations in the electrolytic CO₂ removal facility as well as in the ocean. Monitoring locations referred to throughout this protocol are shown in green.
11.2
In-facility Measurements
11.2.1
Seawater Intake (A)
Project Proponents must monitor intake characteristics through ongoing measurement of carbonate system parameters (pH, DIC, and TA or pCO₂), temperature and salinity, flow rate, and sample frequency of the above parameters. Temperature and salinity are required for determining physical characteristics of the intake, and carbonate system parameters are monitored to validate the amount of carbon removed and extent of carbonate equilibrium in the incoming seawater. When reporting calculated carbonate chemistry variables in the PDD, justification of state of equilibrium, equilibrium constants used in carbonate chemistry speciation software and number of carbonate chemistry parameters used for calculations must be disclosed. Calcium and Magnesium ion concentrations must also be monitored to quantify CDR due to carbonate minerals precipitation if Equation 5 is used. Routine measurements of TSS are required to confirm that all suspended particulate matter is filtered out prior to electrolysis.
11.2.2
Catholyte after Electrolysis (B1)
After electrolysis, the catholyte stream is expected to have elevated pH, reduced DIC, partial consumption of Ca to precipitate CaCO3 and complete consumption of Mg to precipitate Mg(OH)2.
It is recommended that the Project Proponent conducts ongoing measurement of carbonate system parameters (pH, DIC, and TA or pCO2), temperature, salinity and flow rate, as a validation check on carbon accounting. Temperature, salinity and flow rate are required if using Equation 5 to determine the amount of carbon stored in calcium and magnesium carbonate minerals. Measurements of Ca and Mg are recommended to confirm the extent of precipitation of CaCO3 and Mg(OH)2.
11.2.3
Atmospheric Injection Inlet and Outlet (C1)
It is recommended that the Project Proponent uses a mass flow monitor and a carbon dioxide analyzer on the inlet and outlet of the catholyte processing chamber as a validation check for comparison with the total amount of carbon stored (see Section 8.3.2.3).
11.2.4
Post-catholyte Processing and Solids Separation (D1)
After catholyte processing and solids separation, the catholyte stream will have elevated pH, elevated DIC, complete depletion of Ca and restoration of Mg to near intake levels.
Ca concentration and Mg concentration and flow rate are recommended to quantify the precipitation of CaCO3 and dissolution of Mg(OH)2, and are required if using Option 2 for determination of carbonate minerals. These measurements, along with measurements collected at Point A, are used in Equation 5 to construct a calcium and magnesium ion balance to calculate carbon removed in the form of carbonate minerals. It is recommended that the Project Proponent conducts ongoing measurement of carbonate system parameters (pH, DIC, and TA or pCO2), temperature, salinity, as a validation check on carbon accounting.
11.2.5
Anolyte after Electrolysis (B2)
After electrolysis, the anolyte will have reduced pH and potentially reduced DIC due to CO2 outgassing at the anode. Measurements of pH, temperature, salinity and flow rate are required to demonstrate sufficient acid neutralization during anolyte processing. It is recommended that the Project Proponent monitors DIC, Ca and Mg, as a validation check on carbon accounting.
11.2.6
Atmospheric Outgassing at Anode (C2)
It is recommended that the Project Proponent uses a mass flow monitor and a carbon dioxide analyzer on the outlet of anode or anolyte holding chamber as a validation check for comparison with the total amount of carbon stored (see Section 8.3.2.3).
11.2.7
Post-anolyte Processing and Heavy Metals Remediation (D2)
After anolyte processing and heavy metals remediation, the anolyte stream is expected to have elevated pH, elevated TA, elevated Mg and Ca near intake levels. Measurements of pH, temperature, salinity and flow rate are required to demonstrate sufficient acid neutralization during anolyte processing. DIC may be elevated depending on the extent of ingassing caused by elevated pH and decreased pCO2. It is recommended that the Project Proponent monitors DIC, TA, Ca and Mg, as a validation check on carbon accounting and sufficient realkalinization.
11.2.8
Pre-outflow (E)
After catholyte and anolyte streams are recombined prior to discharge, the recombined stream will have elevated pH (pH~8.5), elevated DIC, TA and Mg, and reduced Ca. Project Proponents must monitor carbonate system parameters (pH, DIC, and TA or pCO₂), temperature, salinity, flow rate, TSS and solid phase assemblage at Point E. Three carbonate system variables (inclusive of DIC) must be collected to assess the extent of carbonate equilibrium. The frequency of characterizing solid phase assemblage can decrease upon establishing temporal consistency and correlation with TSS. DIC at Points A and E are to be used in Equation 3, and the additional two carbonate system variables (along with other system variables) must be used to determine any potential losses that may occur upon ocean discharge (see Section 8.1.3).
11.2.9
Throughout the Facility (A-E)
Processes occuring throughout the facility may impact resident biota in seawater. In intake pipes, Project Proponents must take actions to mitigate risk of adversely harming marine biota originally contained in the seawater, and assess the realized ecological impacts of impingement and entrainment in the intake pipe due to pumping, filtering, and treatment of seawater prior to and during the CDR process. Such impacts can be determined though demographic or conditional mortality approaches11.
After preprocessing, any remaining small marine biota (e.g. phytoplankton, bacteria) that are not filtered are not expected to survive the subsequent electrolysis and drastic pH swings in the catholyte and anolyte. Project Proponents are recommended to conduct routine biological samples throughout the facility (e.g. before and at point A, points B1, B2, C1, C2, D1, D2, E) to confirm expectations and/or assess potential biological impacts and changes in community composition of marine microbes being discharged.
11.2.10
Separated Solids
Project Proponents must determine the mass and carbon content of solids removed from the cathode processing stream. Direct measurement of mass may come from truck scales of trucks used to transport solids from the Electrolytic Seawater Mineralization facility to the durable storage location. Other calibrated measures of solids may be appropriate and must be described and justified in the PDD. Mass of separated solids must be evidenced by documentation (e.g., bill of lading). Note that this mass term refers to the total amount of material removed from the site, and may include some water content. Some water content is generally acceptable so long as the mass of water is determined using representative material collected at the time the carbonate-bearing solids are loaded onto the truck for storage.
Project Proponents must determine and report the carbon content of separated solids. Acceptable methods for measuring this term include calcimetry or thermogravimetric analysis of representative samples. A wide variety of physical, chemical and environmental factors can influence the mineralogy and carbonate content of carbonate- and magnesium-bearing carbonate solids (e.g., pH, temperature, salinity, etc). Additionally, the temporary holding conditions can also lead to changes in both mineralogy and carbonate content. For example, transition from meta-stable carbonate phases to more stable phases, and gain or loss of mineral-associated water. In consideration of both possibilities, samples should be collected at the time that mass of solids is weighed.
In the case of samples collected prior to loading for transport via truck, samples should be collected every truck. Sampling frequency may be reduced once project areas can demonstrate less than 1 percent coefficient of variation of for less frequent sampling.
11.3
Ocean Monitoring
The aims of ocean monitoring are to demonstrate permit compliance, monitor environmental conditions, conduct ongoing measurement for quantification, and establish processes for adaptive management to ensure that projects stop if negative impacts are identified.
The ocean monitoring plan must span the following general locations listed below. This Protocol does not prescribe exact ocean monitoring locations because it will vary depending on the project site, local regulations, regional oceanography, etc. Project Proponents are responsible for determining appropriate monitoring locations. It is recommended that Project Proponents use models to plan and optimize sampling design47. A diagram of the monitoring locations, including the location in the water column, must be included in the monitoring plan submitted in the PDD.
11.3.1
Mixing Zone
The area where initial dilution takes place is often called the mixing zone (or "a reasonable mixing zone" or "zone of initial dilution"), typically on the order of ~100m, depending on the scale of discharge. A mixing zone is a regulatory concept, which describes a spatial area surrounding the discharge infrastructure where water quality criteria can be exceeded. Permits which allow for a mixing zone require water quality criteria to be met at the edge of a mixing zone. A mixing zone is a simplified representation of initial mixing, the true spatial extent of initial mixing changes dynamically with environmental conditions.
Detection of a measurable signal may be difficult beyond the mixing zone, especially for small-scale deployments. Beyond the mixing zone, receiving waters are expected to be well-mixed, which can provide more representative measurements of the impact of the discharge. Thus, environmental monitoring should be focused on the edge of the mixing zone.
Project Proponents must monitor temperature, salinity, two carbonate chemistry parameters (pH, TA, DIC, pCO₂), dissolved oxygen (DO), turbidity, and total suspended solids (TSS) at the edge of the mixing zone. Temperature and salinity are necessary for determining physical conditions, and should be co-located with other measured quantities. Two carbonate chemistry parameters (pH, TA, DIC, pCO₂) must be monitored to characterize the carbonate system. It is a known limitation of using pH and pCO₂ measurements to constrain the full carbonate system that uncertainty can be high48. It is therefore recommended a third carbonate system measurement is collected and measured to constrain the full carbonate system (including the state of carbonate disequilibrium) and recalibrate autonomous sensors. DO, turbidity and TSS are water quality indicators. Action thresholds are placed on pH, TSS and DO (see Section 11.3.5: Ocean Monitoring for Ecosystem Safety). Monitoring Chl-a and dissolved inorganic nutrients are also recommended.
11.3.2
Biological and Ecological Monitoring in Deployment Area
Tailored biological and ecological monitoring for specific projects and sites must be determined by conducting an environmental risk assessment and mitigation strategy (see Section 6).
Project Proponents are recommended to conduct periodic ecological surveys to monitor phytoplankton community abundance and composition, benthic community abundance and diversity and presence and potential interactions with species of special concern (IUCN listed, commercially exploited or keystone species). Functional diversity should be considered in addition to taxonomic diversity. Survey sites should include the immediate vicinity of the discharge pipe and specific benthic habitats within the affected area of the project activities to be identified and determined on a site-by-site basis.
Action thresholds are not imposed on ecological indicators due to the difficulty of establishing ecological baselines and attributing ecological changes. Data collection remains imperative for establishing a foundation for future analysis and enabling the assessment of cumulative and chronic impacts of Electrolytic Seawater Mineralization. Ecological data must be made publicly available, and the location of where data is stored publicly must be included in the PDD.
11.3.3
Control Site Guidance
Establishing a control site can help isolate the impacts of project activities from baseline variability. However, finding a control site is challenging due to various factors. Firstly, an ideal control site will have a clear separation between the CDR activity and the control, where the only difference between the two locations is the project activities. Spatially, this means that the correlation scale between relevant parameters should exceed the separation distance (distance between CDR site and control site), while simultaneously, CDR mixing zones must be smaller than the site separation.
However, environmental noise introduces variability, challenging the clear separation of perturbation and control sites. These challenges underscore the difficulty in validating a control site. Thus, for this Protocol, deploying instruments or collecting samples at a control site is determined on a site by site basis as outlined in the PDD and is not universally required.
11.3.4
Ocean Monitoring Frequency and Duration
Monitoring must span pre-deployment, throughout project operations and post-project operations. For pre-deployment environmental monitoring, Project Proponents must provide a baseline characterization of monitored water chemistry and ecological parameters at the site, which should be sufficiently long and well-resolved to characterize background ocean variability. The exact duration and frequency of monitoring will depend on the parameters being measured, as well as site and project specific factors. Listed below are considerations for determining and justifying the monitoring frequency and duration.
The duration of pre-deployment monitoring should consider:
- the timescales of the risks identified in the environmental risk assessment
- duration of CO₂ capture operations
- site-specific residence time
- timescales of natural variability and availability of historical data
Similarly, post-discharge environmental monitoring should consider:
- the timescales of the risks identified in the environmental risk assessment
- site-specific residence time
- timescales of natural variability and availability of historical data
The monitoring frequency should reflect that which is necessary to provide sufficient information about the effluent and receiving waters. Some factors which may influence the frequency and intensity of the monitoring plan include:
- operational capacity of the project. The monitoring frequency may need to be increased at times where the discharge is nearing operational capacity.
- location of the discharge. The monitoring frequency may be more intensive depending on the sensitivity of receiving waters.
- duration and intensity of project operations. The monitoring frequency should differ depending on the duration of project operations and more intense monitoring should occur during ramp-up or operational changes vs. steady state operation. The degree of carbonate chemistry perturbation will also determine the frequency of monitoring required for assessing potential ocean losses.
- seasonality. Seasonal variability of the project site may require more frequent monitoring, particularly during seasons with greater environmental risks.
11.3.5
Ocean Monitoring for Ecosystem Safety
Project Proponents must conduct an environmental risk assessment and develop a mitigation strategy (see Section 6). Thresholds on ocean monitoring parameters are used to determine safe limits for discharge, mitigate environmental risks and identify negative environmental impact.
Two types of thresholds are used:
- Safety thresholds are imposed on the effluent characteristics and controlled prior to discharge.
- Action thresholds are measured at the edge of the mixing zone. Parameters measured are indicators of water quality and/or unintended environmental changes. Action thresholds can be absolute or relative, and can be determined by regulatory limits, relative to natural variability based on historical data or relative to a control site. For example, the action threshold on pH could be 6.5 < pH < 9 or ±0.2 relative to natural variability or to a control site, whichever is more conservative. Action thresholds may vary seasonally, and should be consistent with monitoring requirements under official permitting.
Effective implementation of these measures must also be accompanied by a robust monitoring plan to detect negative impacts and stop projects when necessary.
11.3.5.1
Threshold Violations
Violations are determined based on the threshold type, and specificities of the site, permit and intended activities. For example, exceedance of safety thresholds may be determined by daily mean or max values and exceedance of action thresholds in the mixing zone may be determined by weekly and/or monthly mean or max values. All violations need to be reported, and gaps in ocean monitoring data must be justified.
11.3.5.2
Enforcement Actions
Credits cannot be issued for time periods without sufficient measurements to demonstrate compliance with action and safety thresholds. The handling of data gaps must be reported in the PDD. Removal activity from discharges that occur during time periods of safety threshold violations will not be eligible for crediting. Action threshold violations must trigger adaptive management plans. Failure to adequately address environmental risks or remediate any harm will lead to a project being subject to Credit cessation.
11.4
Summary of Monitored Parameters
Table 2 below summarizes the required and recommended monitoring parameters. Required measurements indicate the minimum common set of measurements needed for all projects under this protocol. Additional required measurements may be necessary based on specifics of the project, site and environmental risk mitigation plan.
Analytical methods for discrete bottle samples are highly recommended to follow the Guide to Best Practices for Ocean CO₂ Measurement48 for carbonate chemistry parameters. Guidance for measurements and sampling strategy will be updated as innovations in measurement develop. The methods, SOPs, and determination of derived terms must be described in the PDD.
Table 2. Summary of required and recommended measurements for monitoring. Required measurements indicate the minimum common set of measurements needed for all projects under this protocol. Additional required measurements for ocean monitoring may be necessary based on specifics of the project, site, and environmental risk mitigation plan. The exact monitoring plan must be described in the PDD.
| Location | Parameter | Requirement Scope | Reason for Measurement | Methods | Frequency |
|---|---|---|---|---|---|
| Seawater intake (A) | pH | Required for all projects | Required for reconciliation of amount of carbon removed (see Section 8.3.2.1) and assessing the state of carbonate equilibrium in incoming seawater | pH sensor or discrete bottle samples (see Appendix 1 for more guidance) | Ongoing throughout deployment, sample frequency of each parameter must be noted in PDD |
| TA or pCO2 | Required for all projects | Required for reconciliation of amount of carbon removed (see Section 8.3.2.1) and assessing the state of carbonate equilibrium in incoming seawater | Discrete bottle samples or pCO2 sensor (see Appendix 1 for more guidance) | ||
| DIC | Required for all projects | Required for quantifying amount of carbon removed (Equation 3) and assessing the state of carbonate equilibrium in incoming seawater | Discrete bottle samples (see Appendix 1 for more guidance) | ||
| Temperature | Required for all projects | Required for determining physical characteristics of intake | Sensor | ||
| Salinity | Required for all projects | Required for determining physical characteristics of intake | Sensor | ||
| Ca and Mg concentration | Required if Option 2 is used to determine (See Section 8.1.2.2) | Recommended to calculate liquid phase ion budget | Discrete bottle samples (e.g., ICP-MS, ICP-OES) or using an ion-selective electrode) | ||
| Flow rate | Required for all projects | Required for determining volume of water processed, used in total carbon removal calculation | Flow meter | ||
| Total Suspended Solids (TSS) | Required for all projects | Required to confirm that all suspended particulate matter is filtered out prior to electrolysis | Discrete bottle samples and filtering directly onto pre-weighed filter and subsequent measurement of mass change through drying (for example, in an oven) or derived from turbidity measurements with routine validation from bottle samples | ||
| Solids phase assemblage | Required for Option 1 for determination of (See Section 8.1.2.1) | Required for quantifying carbon removal via ocean dicharge of carbonate minerals | Calcimetry, thermogravimetric analysis of representative samples | ||
| Catholyte after electrolysis (B1) | pH, TA, DIC, pCO2 | Recommended for all projects | Recommended for validation check on carbon accounting (see Section 8.3.1) | Same as above for seawater intake measurements | Ongoing throughout deployment |
| Temperature, Salinity, Flow rate | Required if Option 2 is used to determine (See Section 8.1.2.2), otherwise recommended for all projects. | Required to calculate liquid phase ion budget, otherwise recommended for validation check on carbon accounting (see Section 8.3.1) | Same as above for seawater intake measurements | ||
| Ca and Mg concentration | Recommended for all projects | Recommended to calculate liquid phase ion budget and confirm extent of mineral precipitation (see Section 8.3.1) | Discrete bottle samples (e.g., ICP-MS, ICP-OES) or using an ion-selective electrode | ||
| Atmospheric injection intake and outflow (C1) | %wt of CO2 in inlet and outlet streams | Recommended for all projects | Recommended for validating the amount of CO2 stored in catholyte stream by comparing the intake and outflow measurements (Equation 6) | Continuous inline gas analyzer for CO2, such as NDIR, TDL, or equivalent. | Ongoing throughout deployment |
| Gas flow rate | Recommended for all projects | Recommended for validating the amount of CO2 stored in catholyte stream by comparing the intake and outflow measurements (Equation 6) | Gas flow rate meter | ||
| Post cathode processing (D1) | Ca concentration, Mg concentration, Temperature, Salinity, flow rate | Required for Option 2 for determination of (See Section 8.1.2.2), otherwise recommended for all projects. | Required to calculate liquid phase ion budget and recommended to quantify the precipitation of CaCO3 and dissolution of Mg(OH)2. | Same as above for seawater intake measurements (A) | Ongoing throughout deployment |
| pH, TA, DIC, pCO2 | Recommended for all projects | Recommended for validation check on carbon accounting (see Section 8.3.1) | Same as above for seawater intake measurements (A) | ||
| Anolyte after electrolysis (B2) | pH, Temperature, Salinity, flow rate | Required for all projects | Required to demonstrate sufficient acid neutralization during anolyte processing | Sensor | Ongoing throughout deployment |
| DIC, Ca and Mg concentration | Recommended for all projects | Recommended to calculate CO2 outgassing/ingassing of the anolyte stream and calculate the liquid phase ion budget | Discrete bottle samples | ||
| Atmospheric outgassing at anode (C2) | %wt of CO2 in outlet streams | Recommended for all projects | Recommended for quantifying the amount of CO2 outgassing at the anode (see Section 8.3.2.3) | Continuous inline gas analyzer for CO2, such as NDIR, TDL, or equivalent. | Ongoing throughout deployment |
| Gas flow rate | Recommended for all projects | Recommended for quantifying the amount of CO2 outgassing at the anode (see Section 8.3.2.3) | Gas flow rate meter | ||
| Anolyte after anolyte processing and solids separation (D2) | pH, Temperature, Salinity, flow rate | Required for all projects | Required to demonstrate sufficient acid neutralization during anolyte processing | Sensor | Ongoing throughout deployment |
| DIC, TA, Ca and Mg concentration | Recommended for all projects | Recommended to calculate CO2 outgassing/ingassing of the anolyte stream, demonstrate sufficient realkalinization, and calculate the liquid phase ion budget | Discrete bottle samples | ||
| Pre-outflow (E) | TSS | Required for all projects | Required for quantifying carbon removal via ocean discharge of carbonate minerals. Required for compliance with TSS discharge limits allowed under official permitting. | Discrete bottle samples and filtering directly onto pre-weighed filter and subsequent measurement of mass change through drying (for example, in an oven) or derived from turbidity measurements with routine validation from bottle samples | Ongoing throughout deployment |
| Solids phase assemblage | Required for Option 1 for determination of (See Section 8.1.2.1) | Required for quantifying carbon removal via ocean dicharge of carbonate minerals | Calcimetry, thermogravimetric analysis of representative samples | Ongoing throughout deployment. Frequency may decrease upon establishing temporal consistency. | |
| DIC, pH, TA or pCO2, Temperature, Salinity, flow rate | Required for all projects | Required for quantifying carbon removal, assessing extent of carbonate equilibrium, and determining potential DIC losses | Discrete bottle samples | Ongoing throughout deployment | |
| Dissolved inorganic nutrients | Recommended for all projects, may be required as part of project-specific environmental risk mitigation strategy | Recommended as an indicator of heavy metal remediation | In situ sensor or discrete water sample via mooring or routine boat sampling | Ongoing throughout deployment | |
| Separated solids | Mass of wet solids removed from catholyte stream | Required for Option 1 for determination of (See Section 8.1.2.1) | Required to determine mass of carbon removed as carbonate solids | Weigh scale | Once per truck |
| Carbon content | Required to convert separated wet solids mass into equivalent mass of CO2 removed as carbonate solids | Calcimetry, thermogravimetric analysis of representative samples | At minimum, collected every truck. Frequency may decrease after the project establishes the consistency of this measurement (See Section 11.2.10) | ||
| Edge of mixing zone (See Section 11.3.1) | Temperature | Required for all projects | Required for determining physical conditions and making calculations to fully constrain the seawater carbonate system | Sensor | (a) at high frequency when ramp-up is occurring and shortly after any dosing rate changes are made (b) with low frequency when the dosing rate is occurring at a steady state |
| Salinity | Required for all projects | Required for determining physical conditions and making calculations to fully constrain the seawater carbonate system | Sensor | ||
| Any two carbonate system paramters: pH, DIC, TA, pCO2 | Required for all projects | Required to constrain the seawater carbonate system, monitor water quality and local carbonate saturation state | Sensor (for pH or pCO₂) or discrete bottle samples | ||
| Third carbonate system paramter | Recommended for all projects | Recommended to assess the local state of carbonate disequilibrium | Sensor (for pH or pCO₂) or discrete bottle samples | ||
| Dissolved Oxygen (DO) | Required for all projects | Required as indicator of general ecosystem health | Sensor | ||
| Total Suspended Solids (TSS) | Required for all projects | Required for monitoring water quality | Discrete bottle samples and filtering directly onto pre-weighed filter and subsequent measurement of mass change through drying (for example, in an oven) or derived from turbidity measurements with routine validation from bottle samples | ||
| Turbidity | Required for all projects | Recommended as part of ecosystem monitoring because elevated turbidity can impact photosynthesis and benthic ecosystem health | Sensor or discrete water sample | ||
| Chlorophyll-a | Recommended for all projects, may be required as part of project-specific environmental risk mitigation strategy | Recommended as an indicator of general ecosystem health (phytoplankton primary productivity) | Sensor or discrete water sample | ||
| Dissolved inorganic nutrients | Recommended for all projects, may be required as part of project-specific environmental risk mitigation strategy | Recommended as an indicator of general ecosystem health (available nutrients for primary productivity) | In situ sensor or discrete water sample via mooring or routine boat sampling | ||
| Deployment area (See Section 11.3.2) | Plankton community | Recommended for all projects, may be required as part of project-specific environmental risk mitigation strategy | Recommended periodically for monitoring of ecosystem health, documentation of shifting baseline ecology and contributions to primary research | Plankton tow or other methods | At agreed upon intervals, before, during and after deployment |
| Benthic community | Recommended for all projects, may be required as part of project-specific environmental risk mitigation strategy | Recommended periodically for monitoring of ecosystem health, documentation of shifting baseline ecology and contributions to primary research. Recommended tissue samples in keystone biological species to track potential trace and heavy metal accumulation. | Benthic survey or other methods | ||
| Throughout facility (A-E) | Marine biota samples | Required for projects with seawater intakes | Required to quantify the impact of seawater processing on resident marine biota (See Section 11.2.9) | Demographic mortality survey, conditional mortality survey, or other methods |
12.0
Definitions and Acronyms
- ActivityThe steps of a Project Proponent’s Removal or Reduction process that result in carbon fluxes. The carbon flux associated with an activity is a component of the Project Proponent’s Protocol.
- BaselineA set of data describing pre-intervention or control conditions to be used as a reference scenario for comparison.
- Buffer PoolA common and recognized insurance mechanism among Registries allowing Credits to be set aside (in this case by Isometric) to compensate for Reversals which may occur in the future.
- BuyerAn entity that purchases Removals or Reductions, often with the purpose of Retiring Credits to make a Removal or Reduction claim.
- Carbon Dioxide Equivalent Emissions (CO₂e)The amount of CO₂ emissions that would cause the same integrated radiative forcing or temperature change, over a given time horizon, as an emitted amount of GHG or a mixture of GHGs. One common metric of CO₂e is the 100-year Global Warming Potential.
- Carbon Dioxide Removal (CDR)Activities that remove carbon dioxide (CO₂) from the atmosphere and store it in products or geological, terrestrial, and oceanic Reservoirs. CDR includes the enhancement of biological or geochemical sinks and direct air capture (DAC) and storage, but excludes natural CO₂ uptake not directly caused by human intervention.
- Carbon FinanceResources provided to projects that are generating, or are expected to generate, greenhouse gas (GHG) Emission Reductions or Removals.
- Cradle-to-GraveConsidering impacts at each stage of a product's life cycle, from the time natural resources are extracted from the ground and processed through each subsequent stage of manufacturing, transportation, product use, and ultimately, disposal.
- Double CountingImproperly allocating the same Removal or Reduction from a Project Proponent more than once to multiple Buyers.
- DurabilityThe amount of time carbon removed from the atmosphere by an intervention – for example, a CDR project – is expected to reside in a given Reservoir, taking into account both physical risks and socioeconomic constructs (such as contracts) to protect the Reservoir in question.
- Embodied EmissionsLife cycle GHG emissions associated with production of materials, transportation, and construction or other processes for goods or buildings.
- Emission FactorAn estimate of the emissions intensity per unit of an activity.
- FeedstockRaw material which is used for CO₂ Removal or GHG Reduction.
- Global Warming PotentialA measure of how much energy the emissions of 1 tonne of a GHG will absorb over a given period of time, relative to the emissions of 1 ton of CO₂.
- Greenhouse Gas (GHG)Those gaseous constituents of the atmosphere, both natural and anthropogenic (human-caused), that absorb and emit radiation at specific wavelengths within the spectrum of terrestrial radiation emitted by the Earth’s surface, by the atmosphere itself, and by clouds. This property causes the greenhouse effect, whereby heat is trapped in Earth’s atmosphere (CDR Primer, 2022).
- LeakageThe increase in GHG emissions outside the geographic or temporal boundary of a project that results from that project's activities.
- Lossesfor open systems, biogeochemical and/or physical interactions which occur during the removal process that decrease the CO₂ removal .
- MaterialityAn acceptable difference between reported Removals/emissions or Reductions/emissions and what an auditor determines is the actual Removal/emissions or Reduction/emissions.
- Mixing ZoneA regulatory concept describing the spatial area surrounding the discharge infrastructure where water quality criteria can be exceeded.
- ModelA calculation, series of calculations or simulations that use input variables in order to generate values for variables of interest that are not directly measured.
- ModuleIndependent components of Isometric Certified Protocols which are transferable between and applicable to different Protocols.
- Monitoring, Reporting, and Verification (MRV)The multi-step process to monitor the Removals or Reductions and impacts of a Project, report the findings to an accredited third party, and have this third party Verify the report so that the results can be Certified.
- ProjectAn activity or process or group of activities or processes that alter the condition of a Baseline and leads to Removals or Reductions.
- Project Design Document (PDD)The document that clearly outlines how a Project will generate rigorously quantifiable Additional high-quality Removals or Reductions.
- Project ProponentThe organization that develops and/or has overall legal ownership or control of a Removal or Reduction Project.
- ProtocolA document that describes how to quantitatively assess the net amount of CO₂ removed by a process. To Isometric, a Protocol is specific to a Project Proponent's process and comprised of Modules representing the Carbon Fluxes involved in the CDR process. A Protocol measures the full carbon impact of a process against the Baseline of it not occurring.
- RegistryA database that holds information on Verified Removals and Reductions based on Protocols. Registries Issue Credits, and track their ownership and Retirement.
- RemovalThe term used to represent the CO₂ taken out of the atmosphere as a result of a CDR process.
- ReservoirA location where carbon is stored. This can be via physical barriers (such as geological formations) or through partitioning based on chemical or biological processes (such as mineralization or photosynthesis).
- SinkAny process, activity, or mechanism that removes a greenhouse gas, a precursor to a greenhouse gas, or an aerosol from the atmosphere.
- SourceAny process or activity that releases a greenhouse gas, an aerosol, or a precursor of a greenhouse gas into the atmosphere.
- StakeholderAny person or entity who can potentially affect or be affected by Isometric or an individual Project activity.
- StorageDescribes the addition of carbon dioxide removed from the atmosphere to a reservoir, which serves as its ultimate destination. This is also referred to as “sequestration”.
- Total AlkalinityDefined as an excess of proton acceptors over proton donors, which functionally describes the ability of a solution to neutralize acids to the CO₂ equivalence point.
- UncertaintyA lack of knowledge of the exact amount of CO₂ removed by a particular process, Uncertainty may be quantified using probability distributions, confidence intervals, or variance estimates.
- ValidationA systematic and independent process for evaluating the reasonableness of the assumptions, limitations and methods that support a Project and assessing whether the Project conforms to the criteria set forth in the Isometric Standard and the Protocol by which the Project is governed. Validation must be completed by an Isometric approved third-party (VVB).
- Validation and Verification Bodies (VVBs)Third-party auditing organizations that are experts in their sector and used to determine if a project conforms to the rules, regulations, and standards set out by a governing body. A VVB must be approved by Isometric prior to conducting validation and verification.
13.0
Appendix 1 : Guidance for High Quality Marine Data Collection
This Appendix is general for marine CDR approaches: Ocean Alkalinity Enhancement (OAE), Direct Ocean Capture (DOC), Electrolytic Seawater Mineralization
13.1
Introduction
Field measurements play an important role in:
- ensuring sufficient and up to date baseline marine data
- providing data for calibration and validation of ocean models
- monitoring environmental health during and after project activity
Broadly, field measurements may include moored in-situ sensors, ship-based or autonomous transecting and profiling, discrete bottle sampling, field surveys, aerial imaging and remote sensing. There is significant variability in the specific instruments and field methods that may be used to conduct collect data.
Project Proponents must provide thorough documentation on planned and completed field campaigns, including details on the campaign design (spatial and temporal coverage, sampling density, data collection techniques, instrument resolution), metadata, data processing, analytical and statistical techniques, instrument calibration and data quality control. In the sections that follow, we highlight some recommended references and best practices to ensure high quality data generation from field measurements.
Collecting discrete bottle samples alongside continuous autonomous sensor measurements is recommended. Both measurement types offer advantages, for example autonomous sensors can offer wider temporal coverage, while bottle samples are crucial for ground truthing absolute values. Additionally, bottle samples can be used to calibrate drift of long term autonomous sensor deployments.
To facilitate accessibility, transparency and interoperability of research relevant data, data collected from field campaigns must adhere to FAIR data principles 49. Project Proponents should follow the data standards and controlled vocabularies described in Guide to Best Practices in Ocean Alkalinity Research: Chapter 13–Data reporting and sharing for ocean alkalinity enhancement research 50. Metadata should be complete according to the NOAA ocean acidification metadata template 51.
13.2
Alkalinity and pH Measurements
Alkalinity is used in multiple fields that may have different terminology and definitions. For example, total or titration alkalinity is widely used in oceanography, whereas charge balance alkalinity is commonly used in freshwater systems and by geologists52. This Protocol uses the oceanographic community terminology when referring to measurements taken in the ocean, where total alkalinity (TA) for seawater is defined following Dickson 1981 based on acid titration to the CO2 equivalence point53. However, alternative definitions of alkalinity that may be more appropriate for specific projects (e.g. for non-seawater systems, such as effluent from a wastewater stream) should be specified in the PDD.
There are also different scales used for pH measurements which may differ by over 0.154. For example, the National Bureau of Standards (NBS) scale is suitable for freshwater systems and waters with low ionic strength, while for seawater, the total hydrogen ion scale is more commonly used55. This protocol recommends the total hydrogen ion scale for seawater pH measurements, following the SOPs below in the Guide to Best Practices for Ocean CO2 Measurements. Care should be taken to account for differences in pH scales, such as when comparing pH measurements against regulatory thresholds.
13.3
Specific Guidance for Bottle Samples
For discrete bottle samples, we refer Project Proponents to the Best Practice Data Standards for Discrete Chemical Oceanographic Observations 56. Additional considerations for discrete bottle sampling of carbonate chemistry are discussed in Guide to Best Practices in Ocean Alkalinity Research: Chapter 2 (Seawater carbonate chemistry considerations for ocean alkalinity enhancement research: theory, measurements and calculations) 28.
Recommended analytical methods for bottle samples include:
| Parameter | Recommended Method |
|---|---|
| Carbonate Chemistry parameters (pH, DIC, TA) | Guide to Best Practices for Ocean CO2 Measurements |
| Nutrients | Methods of Seawater Analysis |
| Salinity | TEOS-10 |
| Dissolved Oxygen | Methods of Seawater Analysis |
| Chl-a | Welschmeyer 1994 |
| TSS | Methods of Seawater Analysis |
| Trace metals | GEOTRACES cookbook |
The following methods are approved by the Clean Water Act, EPA:
13.4
Specific Guidance for Autonomous Ocean Instruments
For autonomous instruments, Project Proponents are recommended to follow manufacturer provided user manuals for instrument preparation, maintenance, calibration and quality control. Environmental and deployment factors which may affect the quality and interpretation of data, (e.g. instrument orientation, interference, presence of bubbles, sediment, and biology) must be described.
Adoption of innovative sensor technologies is encouraged. For novel sensors, additional information that would typically be available from a manufacturer would also have to be provided. These include detection range, resolution, accuracy, performance under different environmental conditions (i.e., temperature ranges) and response time. The expected measurement conditions must be within the sensor’s range.
13.4.1
Pre-deployment
Project Proponents must perform instrument calibration before deployment, and recalibrate instruments at an interval recommended by the manufacturer. Calibration curves or equations for the instrument or sensor must be documented. Post-deployment calibration is recommended to account for instrument drift over the deployment duration.
13.4.2
Maintenance During Deployment
Project Proponents must develop a maintenance plan for moored instruments deployed longer than 30 days. This should include plans to clean or replace sensors that may be impacted by biofoul, such as optical sensors, conductivity cells or flow through sensors.
13.4.3
Data Post-processing
Data processing techniques must be documented, including quality control, filtering, despiking and statistical analysis. The recommended quality control process differs between instruments. Data should be reported using quality control flags consistent with International Oceanographic Data and Information Exchange (IODE)57.
The quality control manuals for autonomous instruments prepared by the Integrated Ocean Observing System are a recommended resource.
Quality control checks could include:
- completeness of observations
- ordering of data
- check against physically valid limits
- check data obeys physical laws
- checking statistical tests
- checking regularities of space and time variations
Data Analysis Methods for Physical Oceanography is a recommended resource for statistical analysis methods 58.
13.5
Specific Guidance for Tracer Studies
Tracer studies track effluent using a tracer that is either naturally present or added. They can be useful for mCDR projects to:
- characterize DIC-deficient or alkalinity-enhanced plume transport
- validate physical transport in the ocean model via tracking plume movement
- validate alkalinity uptake via dual tracer regression for OAE projects (Project Proponents are not expected to perform dual tracer regression)
Ideal tracers are not harmful to the environment, have near zero background concentration, are conservative or decay very slowly in relation to the duration of field work, mix freely and can be measured in the field at low concentrations. As such, examples of tracers that may be used in DOC are fluorescent dyes (i.e. rhodamine dye) and gas tracers (SF6, CH3, SF5, 3He).
Fluorescent dye tracers, such as rhodamine dye, are preferable because they can be detected from aerial imaging or high frequency in situ sensors. Rhodamine dye degrades in days to weeks, and can be helpful for characterizing near-field mixing. Gas tracers have a lifespan on the order of years, and can be useful for large scale experiments, however, they have high Global Warming Potential.
Tracers can be injected into the effluent to increase the trackability of the effluent. Alternatively, the tracer dye can be released directly into the water column as a slug release, to help constrain localized dispersion characteristics for coastal models.
If a tracer study is conducted to characterize pCO2-plume transport, the sampling plan must include vertical profiling along transects. A sufficient number of studies are required to produce a sensitivity analysis. Sampling plan, data analysis and interpretation will be evaluated on a case by case basis.
The US EPA Operating Procedure59 and USGS Procedure for Dye Tracer Measurements60 are recommended resources.
The following checklist can be referenced for tracer release studies using rhodamine dye to validate an ocean model or characterize plume transport.
Study planning:
- duration of release should give sufficient time for the field team to complete sampling (this will be site specific)
- required tracer quantity should be based on sensor detection limit, effluent flow rate, duration of test and site specific dilution capacity
Materials preparation:
- prepare dye mixture, ensuring the correct units of dye concentration are used
- dye injection pump should be calibrated in lab to confirm desired volumetric dosage rate
- include release rate at different battery levels and temperature
- prepare instrument and site specific calibration curve between dye concentration and effluent concentration
Release:
- if released with effluent, released at a rate proportional to effluent release rate
- if released with effluent, tracer must be added at an adequate mixing length before final discharge
- if released with effluent, sample from an access valve to measure concentration prior to final discharge
- density and velocity matching for effluent or slug release are considered
- no additions after the injection point
Sampling (ship-based or underway system):
- prior to release, conduct spatial salinity and temperature profiling.
- for ship based sampling, sensor should be placed off the bow, firmly braced and clear of bow waves to minimize disturbance due to wake of the vessel.
- positioning via GPS or triangulation should be +/- 2.5m to ensure sampling station. positions and boat tracks are accurate
- for all measurements, record metadata including sample location, time, depth, sensor probe and other visual observations.
- note areas of high concentrations beyond the mixing zone, as this can signal accumulation or recirculation, which cause the effluent to resurface elsewhere.
Data quality and interpretation:
- consider accuracy of positioning data, variation in discharge flow rate, variability in environmental conditions, calibration curve and measurement method in the interpretation of results.
13.6
Ocean Monitoring Examples
Below are some hypothetical examples that are for illustrative purposes only, to demonstrate some of the site and project considerations when determining the appropriate monitoring duration and frequency for a particular parameter and use case.
Example 1
An OAE project is monitoring for changes in ocean pH near the discharge site to make sure the change in pH does not exceed a threshold of +/-0.2 of the natural variability of pH. The dosing period is 1 week, and the residence time of the region where pH sensors are deployed is 1 day. At this site, it is known from previous studies and published literature that the dominant temporal modes of variability for pH are diurnal and seasonal, due to biological activity. Monitoring duration: Because the activity and dosing period are much shorter than the seasonal variability in this case, it is not necessary for the baseline characterization to span a full year to resolve the seasonal cycle. Instead, the baseline monitoring for a few days before deployment is sufficient. There is ongoing monitoring during the 7 day dosing period, and the post-dosing monitoring for pH should additionally span at least the residence time. To be conservative and to collect additional safety data though, the project decides to extend post-dosing monitoring for 1 week. Monitoring frequency: To resolve the diurnal cycle variability, sampling should be conducted at a higher frequency than daily, e.g. sampling at minimum every 6 hours would result in at least 4 measurements per day and would be sufficient here. Luckily, the project uses continuous pH sensors, which allows them to sample much more frequently to fully resolve the diurnal cycle.
Example 2
An environmental risk of a mineral OAE project that the local community is concerned about is bioaccumulation of metals in a nearby oyster farm. To address this, the project is monitoring the concentration of trace metals in oyster tissues before and after the project activity. The project is dosing feedstock particles into the ocean for 1 week, but some of the feedstock will accumulate on the seafloor and it can take up to 3 months for the particles to fully dissolve. The farm grows oysters in the ocean for 1 year before harvesting. Monitoring frequency: The accumulation of any metals in oysters will take some time, especially because it will take a few months after project dosing completes for the feedstock particles to dissolve. Thus it was decided to sample the oysters once a month for the first 3 months following the project since that is the period during which particle dissolution is expected to occur, and then once a season after that. Monitoring duration: In this case, the community would like to know the impacts on the oysters that are being harvested for food. So the post-deployment monitoring lasts for 1 year post-dosing (taking seasonal samples) to span the oysters growth cycle and to ensure that metal concentrations do not exceed the local food safety regulatory limits. A control sample was collected from a number of oysters pre-deployment.
14.0
Relevant Works
Footnotes
-
La Plante, E. C., Chen, X., Bustillos, S., Bouissonnie, A., Traynor, T., Jassby, D., Corsini, L., Simonetti, D. A., & Sant, G. N. (2023). Electrolytic Seawater Mineralization and the Mass Balances That Demonstrate Carbon Dioxide Removal. ACS ES&T Engineering, 3(7), 955–968. https://doi.org/10.1021/acsestengg.3c00004. ↩ ↩2
-
La Plante, E. C., Simonetti, D. A., Wang, J., Al-Turki, A., Chen, X., Jassby, D., & Sant, G. N. (2021). Saline Water-Based Mineralization Pathway for Gigatonne-Scale CO2 Management. ACS Sustainable Chemistry & Engineering, 9(3), 1073–1089. https://doi.org/10.1021/acssuschemeng.0c08561 ↩
-
Steenkamp, R. and Webb, R. (2023) Legal considerations relevant to research on ocean alkalinity enhancement. State of the Planet. https://doi.org/10.5194/sp-2-oae2023-10-2023 ↩ ↩2
-
Permitting for mCDR and mSRM. United States Environmental Protection Agency. Retrieved May 17, 2024, from https://www.epa.gov/ocean-dumping/permitting-mcdr-and-msrm ↩
-
National Academies of Sciences, Engineering, and Medicine. (2022). A Research Strategy for Ocean-based Carbon Dioxide Removal and Sequestration. Washington, DC: The National Academies Press. https://doi.org/10.17226/26278. ↩ ↩2
-
Satterfield et al. (2023) Social considerations and best practices to apply to engaging publics on ocean alkalinity enhancement. State of the Planet. https://doi.org/10.5194/sp-2-oae2023-11-2023 ↩
-
Montserrat, F., Renforth, P., Hartmann, J., et al. (2017) Olivine dissolution in seawater: implications for CO₂ sequestration through enhanced weathering in coastal environments. Environmental Science and Technology 51, 7, 3960–3972. https://doi.org/10.1021/acs.est.6b05942 ↩
-
Flipkens, G., Blust, R., and Town, R. M. (2021) Deriving nickel (Ni (II)) and chromium (Cr (III)) based environmentally safe olivine guidelines for coastal enhanced silicate weathering. Environmental Science and Technology 55, 18, 12362–12371. https://doi.org/10.1021/acs.est.1c02974 ↩
-
Bach, L.T., Gill, S.J., Rickaby R.E.M., et. al. (2019) CO₂ Removal With Enhanced Weathering and Ocean Alkalinity Enhancement: Potential Risks and Co-benefits for Marine Pelagic Ecosystems. Frontiers in Climate. 1:7. doi: 10.3389/fclim.2019.00007 ↩ ↩2 ↩3 ↩4
-
Albright, R., Caldeira, L., Hosfelt, J. et al. (2016). Reversal of ocean acidification enhances net coral reef calcification. Nature 531, 362–365. https://doi.org/10.1038/nature17155 ↩
-
Cripps, G., Widdicombe, S., Spicer, J. and Findlay, H. (2013) Biological impacts of enhanced alkalinity in Carcinus maenas. Marine Pollution Bulletin. https://doi.org/10.1016/j.marpolbul.2013.03.015 ↩ ↩2
-
Langer, G., M. Geisen, K.-H. Baumann, J., et. al. (2006). Species-specific responses of calcifying algae to changing seawater carbonate chemistry. Geochemistry, Geophysics, Geosystems, 7, Q09006, doi:10.1029/2005GC001227 ↩ ↩2
-
Missimer, T., Maliva, R. (2018). Environmental issues in seawater reverse osmosis desalination: Intakes and outfalls. Desalination. https://doi.org/10.1016/j.desal.2017.07.012 ↩
-
Hogan, T. W. (2015). Impingement and entrainment at SWRO Desalination Facility intakes. Environmental Science and Engineering. https://doi.org/10.1007/978-3-319-13203-7_4 ↩ ↩2
-
Harvell, C. D., Mitchell, C. E., Ward, J. R., Altizer, S., Dobson, A. P., Ostfeld, R. S., & Samuel, M. D. (2002). Climate warming and disease risks for terrestrial and marine biota. Science, 296(5576), 2158–2162. https://doi.org/10.1126/science.1063699 ↩
-
BS EN 15978:2011 Sustainability of construction works - Assessment of environmental performance of buildings - Calculation method ↩ ↩2 ↩3 ↩4 ↩5 ↩6
-
IPCC, 2023: Climate Change 2023: Synthesis Report. Contribution of Working Groups I, II and III to the Sixth Assessment Report of the Intergovernmental Panel on Climate Change [Core Writing Team, H. Lee and J. Romero (eds.)]. IPCC. doi: 10.59327/IPCC/AR6-9789291691647. ↩
-
Derwent, R., Simmonds, P., O’Doherty, S., Manning, A., Collins, W., & Stevenson, D. (2006). Global environmental impacts of the hydrogen economy. International Journal of Nuclear Hydrogen Production and Applications, 1(1), 57–67. https://doi.org/10.1504/IJNHPA.2006.009869 ↩
-
Sand, M., Skeie, R. B., Sandstad, M., Krishnan, S., Myhre, G., Bryant, H., Derwent, R., Hauglustaine, D., Paulot, F., Prather, M., & Stevenson, D. (2023). A multi-model assessment of the Global Warming Potential of hydrogen. Communications Earth & Environment, 4(1), 203. https://doi.org/10.1038/s43247-023-00857-8. ↩
-
International Organization for Standardization. (2006). ISO 14044:2006 Environmental management — Life cycle assessment — Requirements and guidelines. https://www.iso.org/standard/38498.html ↩ ↩2
-
Pytkowicz (1965). Calcium Carbonate Precipitation in the Ocean. Limnology and Oceanography. https://doi.org/10.4319/lo.1965.10.2.0220 ↩
-
Moras, C. A., Bach, L. T., Cyronak, T., et. al. (2022). Ocean alkalinity enhancement – avoiding runaway CaCO3 precipitation during quick and hydrated lime dissolution, Biogeosciences, 19, 3537–3557, https://doi.org/10.5194/bg-19-3537-2022 ↩
-
Turchyn AV, Bradbury HJ, Walker K and Sun X. (2021) Controls on the Precipitation of Carbonate Minerals Within Marine Sediments. Frontiers in Earth Science 9:618311. doi: 10.3389/feart.2021.618311 ↩
-
Renforth, P., and G. Henderson. (2017). Assessing ocean alkalinity for carbon sequestration, Reviews of Geophysics, 55, 636–674, doi:10.1002/2016RG000533 ↩ ↩2
-
Morse, J. W., He, S. (1993). Influences of T, S and P CO₂ on the pseudo-homogeneous precipitation of CaCO3 from seawater: implications for whiting formation. Marine Chemistry. https://doi.org/10.1016/0304-4203(93)90261-L ↩
-
Wurgaft, E., Wang, Z. A., Churchill, J. H., Dellapenna, T., Song, S., Du, J., et al. (2021). Particle triggered reactions as an important mechanism of alkalinity and inorganic carbon removal in river plumes. Geophysical Research Letters, 48, e2021GL093178. https://doi.org/10.1029/2021GL093178 ↩
-
Ringham, M., Hirtle, N., Shaw, C., Lu, X., Herndon, J., Carter, B., and Eisaman, M. (2024). A comprehensive assessment of electrochemical ocean alkalinity enhancement in seawater: kinetics, efficiency, and precipitation thresholds, EGUsphere [preprint], https://doi.org/10.5194/egusphere-2024-108 ↩ ↩2
-
Schulz, K. G., Bach, L. T., and Dickson, A. G.: Seawater carbonate chemistry considerations for ocean alkalinity enhancement research: theory, measurements, and calculations. State of the Planet, 2-oae2023, 2, https://doi.org/10.5194/sp-2-oae2023-2-2023. ↩ ↩2
-
Moras, C. A., Bach, L. T., Cyronak, T., Joannes-Boyau, R., and Schulz, K. G. (2022) Ocean alkalinity enhancement – avoiding runaway CaCO3 precipitation during quick and hydrated lime dissolution, Biogeosciences, 19, 3537–3557, https://doi.org/10.5194/bg-19-3537-2022. ↩ ↩2
-
Iglesias-Rodríguez, M. D., Rickaby, R. E. M., Singh, A., and Gately, J. A. (2023). Laboratory experiments in ocean alkalinity enhancement research, in: Guide to Best Practices in Ocean Alkalinity Enhancement Research, Copernicus Publications, State Planet, 2-oae2023, 5, https://doi.org/10.5194/sp-2-oae2023-5-2023. ↩
-
He and Tyka (2023) Limits and CO2 equilibration of near-coast alkalinity enhancement. Biogeosciences, 20, 27–43. https://doi.org/10.5194/bg-20-27-2023 ↩
-
Jokiel, P. L. (2011). The reef coral two compartment proton flux model: A new approach relating tissue-level physiological processes to gross corallum morphology. Journal of Experimental Marine Biology and Ecology, 409(1–2), 1–12. https://doi.org/10.1016/j.jembe.2011.10.008 ↩
-
Bach, L. T. (2015). Reconsidering the role of carbonate ion concentration in calcification by marine organisms. Biogeosciences, 12(16), 4939-4951. ↩
-
Monteiro, F. M., Bach, L. T., Brownlee, C., Bown, P., Rickaby, R. E. M., Poulton, A. J., et al. (2016). Why marine phytoplankton calcify (supplement). Sci. Adv. 2:e1501822. doi: 10.1126/sciadv.1501822 ↩
-
The IUCN Red List of Threatened Species, Protected Area and Key Biodiversity Area data downloaded from the Integrated Biodiversity Assessment Tool (IBAT) (http://www.ibat-alliance.org). Provided by BirdLife International, Conservation International, IUCN and UNEP-WCMC. Please contact ibat@ibat-alliance.org for further information ↩ ↩2
-
Renforth, P. (2019) The negative emission potential of alkaline materials. Nature Communications 10, 1401. https://doi.org/10.1038/s41467-019-09475-5 ↩ ↩2 ↩3
-
Hay, B. J. (1988). Sediment accumulation in the central western part of the Black Sea over the last 5100 years. Paleoocenography 3, 491–508. doi:10.1029/PA003i004p00491 ↩
-
Kopelevich, O., Burenkov, V., Sheberstov, S., Vazyulya, S., Kravchishina, M., Pautova, L., et al. (2014). Satellite monitoring of coccolithophore blooms in the Black Sea from ocean color data. Remote Sens. Environ. 146, 113–123. doi: 10.1016/j.rse.2013.09.009 ↩
-
For example, see Bach et al. (2013) New Phytologist, Bach et al. (2015) Progress in Oceanography, Gafar et al.(2018) Frontiers in Marine Science and others. ↩
-
Bednaršek, N., Pelletier, G., van de Mortel, H., García-Reyes, M., Feely, R., and Dickson, A.: Unifying framework for assessing sensitivity for marine calcifiers to ocean alkalinity enhancement identifies winners, losers and biological thresholds – importance of caution with precautionary principle, EGUsphere [preprint] doi.org/10.5194/egusphere-2024-947 ↩
-
Bach, L. T. (2023) The additionality problem of Ocean Alkalinity Enhancement. Biogeosciences 21, 261–277. https://bg.copernicus.org/articles/21/261/2024/ ↩
-
Turvey, C. C., Wynands, E. R., & Dipple, G. M. (2022). A new method for rapid brucite quantification using thermogravimetric analysis. Thermochimica Acta, 718, 179366. https://doi.org/10.1016/j.tca.2022.179366 ↩
-
Bach, L.T., Vaughan, N.E., Law, C.S., Williamson, P. (2024). Implementation of marine CO2 removal for climate mitigation: The challenges of additionality, predictability, and governability, Elementa: Science of the Antropocene https://doi.org/10.1525/elementa.2023.00034 ↩
-
Harrison, A. L., Mavromatis, V., Oelkers, E. H., & Bénézeth, P. (2019). Solubility of the hydrated Mg-carbonates nesquehonite and dypingite from 5 to 35 °C: Implications for CO2 storage and the relative stability of Mg-carbonates. Chemical Geology, 504, 123–135. https://doi.org/10.1016/j.chemgeo.2018.11.003 ↩
-
Feely, Richard A., Sabine, C. L., Lee, K., Berelson, W., Kleypas, J., Fabry, V. J., Millero, F. J. (2004). Impact of Anthropogenic CO2 on the CaCO3 System in the Oceans. Science 305, 362-366. DOI: https://doi.org/10.1126/science.1097329 ↩ ↩2
-
Atkinson, C. A., Jolley, D. F., & Simpson, S. L. (2007). Effect of overlying water pH, dissolved oxygen, salinity and sediment disturbances on metal release and sequestration from metal contaminated marine sediments. Chemosphere, 69(9), 1428–1437. https://doi.org/10.1016/j.chemosphere.2007.04.068 ↩
-
Mu et al. (2023) Considerations for hypothetical carbon dioxide removal via alkalinity addition in the Amazon River watershed, EGUsphere, https://doi.org/10.5194/bg-20-1963-2023 ↩
-
Dickson, A.G. Sabine, C.L. and Christian, J.R. (2007) Guide to best practices for ocean CO2 measurement. North Pacific Marine Science Organization, 191pp. (PICES Special Publication 3; IOCCP Report 8). DOI: https://doi.org/10.25607/OBP-1342 ↩ ↩2
-
Wilkinson, M., Dumontier, M., Aalbersberg, I. et al. (2016). The FAIR Guiding Principles for scientific data management and stewardship. Scientific Data 3, 160018. https://doi.org/10.1038/sdata.2016.18 ↩
-
Jiang, L.-Q., Subhas, A. V., Basso, D., Fennel, K., and Gattuso, J.-P. (2023) Data reporting and sharing for ocean alkalinity enhancement research. State of the Planet 2-oae2023, 13, https://doi.org/10.5194/sp-2-oae2023-13-2023 ↩
-
National Oceanic and Atmospheric Administration , (2023). OA Metadata Template (Version 2.0). National Centers for Environmental Information. https://www.ncei.noaa.gov/access/ocean-carbon-acidification-data-system/oa-metadata-template/ ↩
-
Middelburg, J. J., Soetaert, K., and Hagens, M. (2020) Ocean Alkalinity, Buffering and Biogeochemical Processes. Reviews of Geophysics, 58, https://doi.org/10.1029/2019RG000681 ↩
-
Dickson, A. G., An exact definition of total alkalinity and a procedure for the estimation of alkalinity and total inorganic carbon from titration data. Deep Sea Research Part A. Oceanographic Research Papers, 28 (6), 609-623. https://doi.org/10.1016/0198-0149(81)90121-7 ↩
-
Mario, G. M., Millero, F. J., Camões, M.F., Spitzer, P., Feistel, R., and Chen, C.-T.A. (2011) pH of seawater. Marine Chemistry, 126(1-4), 89-96. https://doi.org/10.1016/j.marchem.2011.04.002 ↩
-
Pimenta, A. R., and Grear, J. S. (2018). Guidelines for Measuring Changes in Seawater pH and Associated Carbonate Chemistry in Coastal Environments of the Eastern United States. United States Environmental Protection Agency. Retrieved July 1, 2024, from https://www.goa-on.org/documents/resources/east-us-measuring_seawater_ph_changes-guide.pdf ↩
-
Jiang, L., Pierrot, D., Wanninkhof, R. et al. (2023). Best Practice Data Standards for Discrete Chemical Oceanographic Observations. Frontiers in Marine Science. https://www.frontiersin.org/articles/10.3389/fmars.2021.705638/full ↩
-
Bushnell M, Waldmann C, Seitz S, et al. (2019). Quality Assurance of Oceanographic Observations: Standards and Guidance Adopted by an International Partnership. Frontiers in Marine Science, 6:706 https://www.frontiersin.org/articles/10.3389/fmars.2019.00706/full ↩
-
Thomson, R. and Emery, W. (2014) Data Analysis Methods in Physical Oceanography. https://www.sciencedirect.com/book/9780123877826/data-analysis-methods-in-physical-oceanography#book-description ↩
-
Science and Ecosystem Support Divison (2017). Dye Tracer Measurements Operating Procedure. U.S. Environmental Protection Agency. https://www.epa.gov/sites/default/files/2017-07/documents/dye_tracer_measurements514_af.r2.pdf ↩
-
Wilson, J. F., Cobb, E. D., & Kilpatrick, F. A. (1986). Fluorometric procedures for dye tracing. In Techniques of Water-Resources Investigations (03-A12). Dept. of the Interior, U.S. Geological Survey; For sale by the Books and Open-File Reports Section, U.S. Geological Survey,. https://doi.org/10.3133/twri03A12 ↩
Contributors

Jennifer Yin, Ph.D.

Kevin Sutherland, Ph.D.

Jing He, Ph.D.

Sophie Gill, Ph.D.
Isometric
Electrolytic Seawater Mineralization © 2025 Isometric HQ Ltd is licensed under CC BY-NC-ND 4.0